
Figures & data
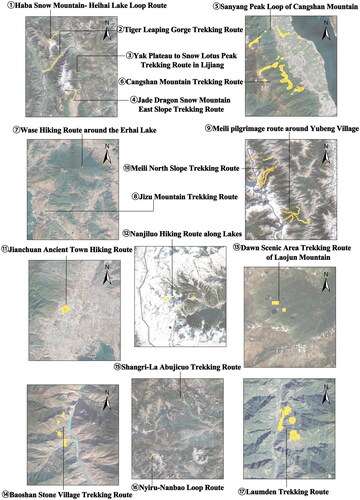
Figure 1. Location of the study area.
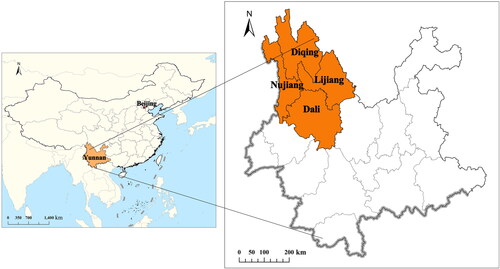
Figure 2. Annual change in the number of hikers’ trajectories.
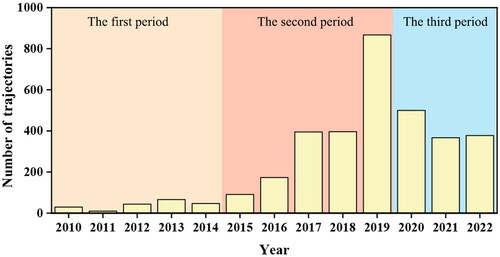
Figure 3. Monthly change in the number of hikers’ trajectories.
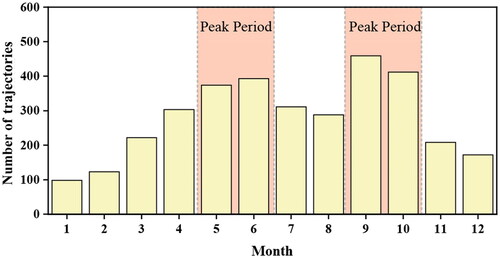
Figure 4. Numbers of trajectories in different departure time and arrival time of hikers.
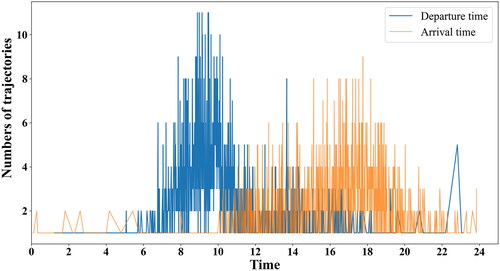
Table 1. Final cluster centres.
Figure 5. The national source of hikers in Northwest Yunnan.
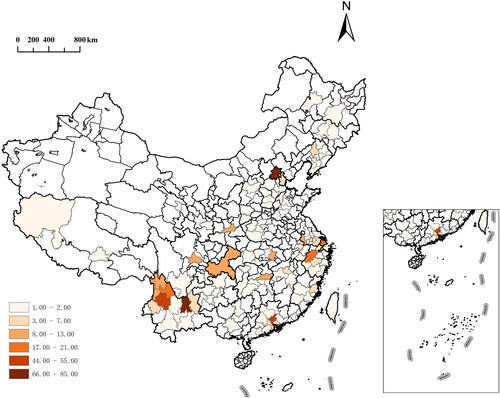
Figure 6. The kernel density of hiking interest points in three stages.
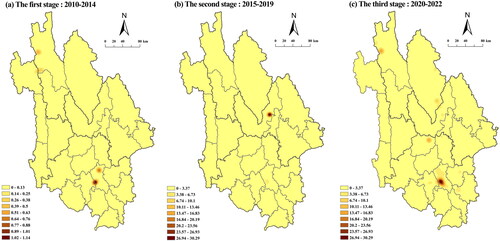
Figure 7. The line density of hiking trajectories: the first stage.
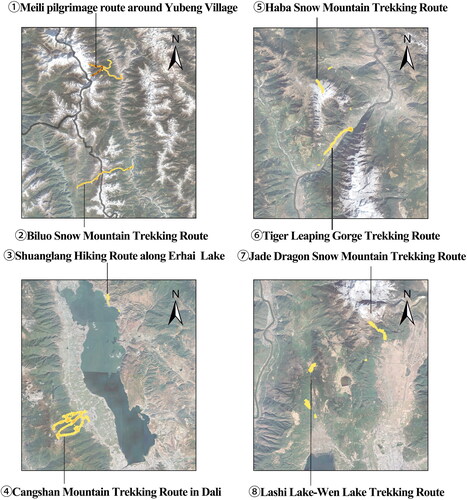
Figure 8. The line density of hiking trajectories: the second stage.
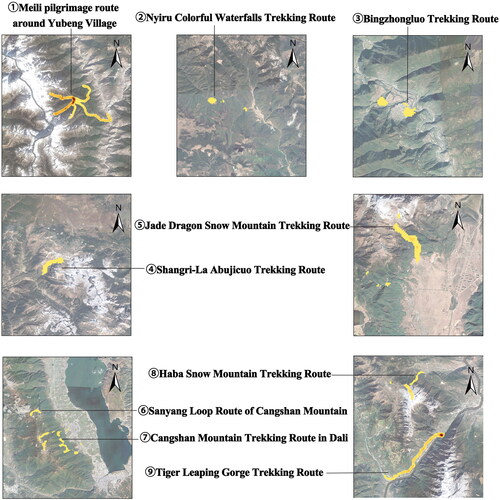
Figure 9. The line density of hiking trajectories: the third stage.
Data availability statement
The data that support the findings of this study are available on request from the lead author.