
Figures & data
Figure 1. The research methodology flowchart.
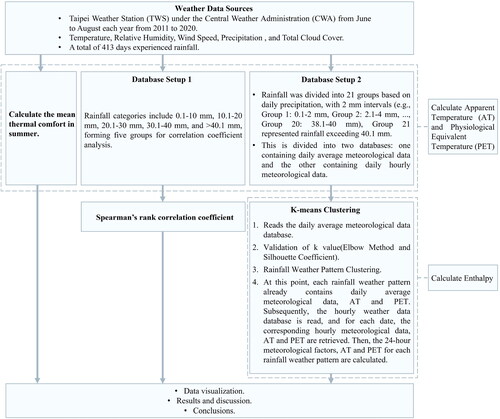
Figure 2. Location of TWS.
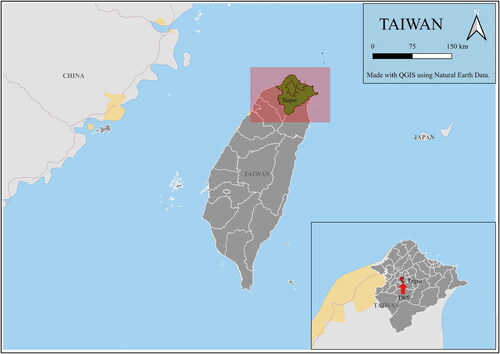
Figure 3. Example of RWP calculation (0.2–4 mm rainfall).
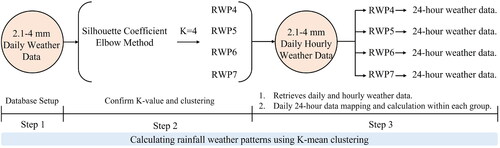
Figure 4. Mean thermal comfort in summer 2011–2020.
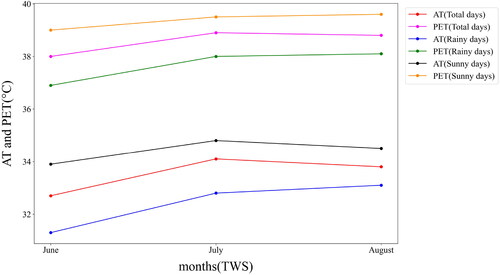
Figure 5. Box plots of thermal comfort in summer 2011–2020.
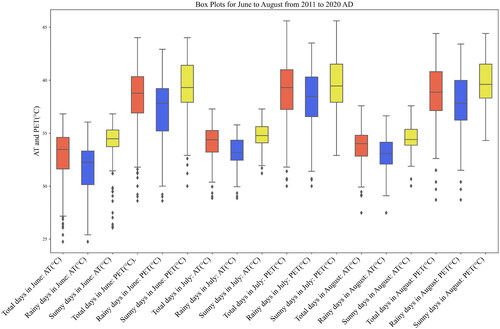
Figure 6. Heat maps of Spearman’s rank correlation coefficients: (a) 0.1–10 mm rainfall, (b) 10.1–20 mm rainfall, (c) 20.1–30 mm rainfall, (d) 30.1–40 mm rainfall, and (e) >40.1 mm rainfall.
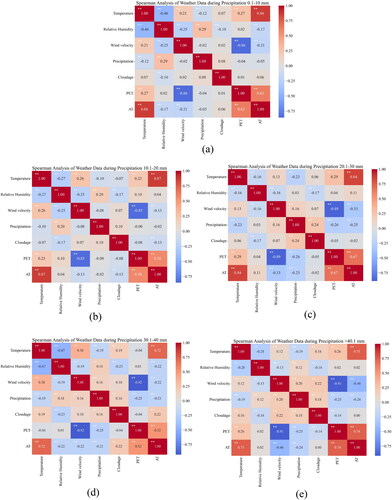
Figure 7. Optimal k-values for RWP grouping.
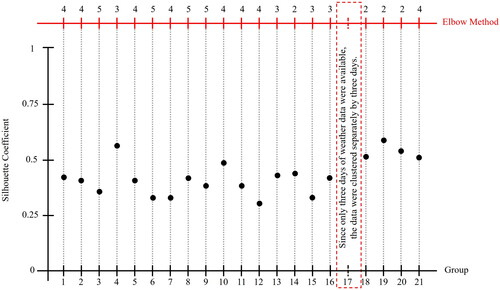
Figure 8. Changes in AT, PET, and precipitation over one day under RWP43 and RWP46.
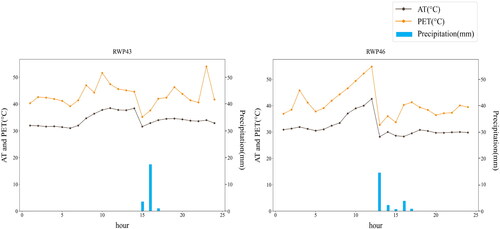
Figure 9. Changes in sensible heat and latent heat over one day under RWP43 and RWP46.
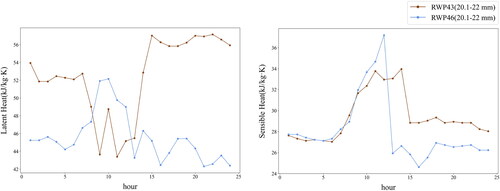
Figure 10. Changes in AT, PET, and precipitation over one day under RWP49.
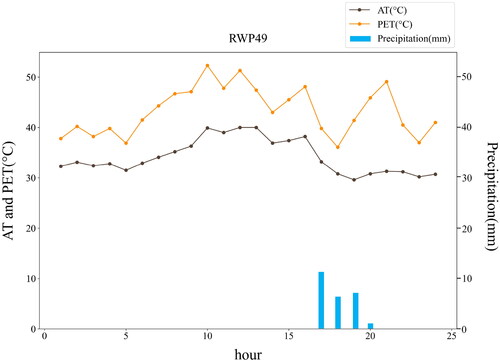
Figure 11. Changes in sensible heat and latent heat over one day under RWP49.
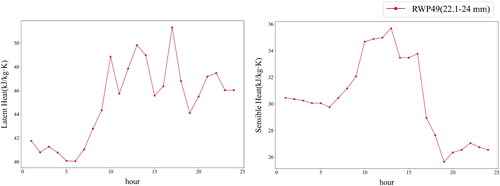
Figure 12. Changes in AT, PET, and precipitation over one day under RWP0, RWP1 and RWP3.
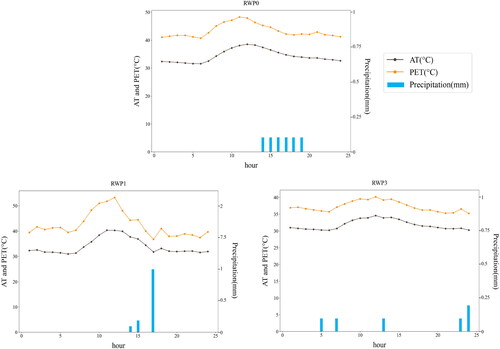
Figure 13. Changes in sensible heat and latent heat over one day under RWP0, RWP1 and RWP3.
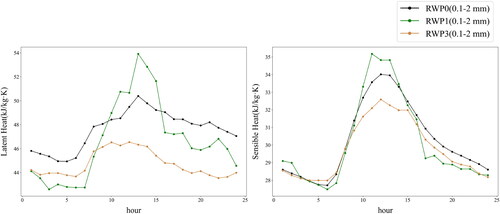
Figure 14. Changes in AT, PET, and precipitation over one day under RWP6 and RWP7.
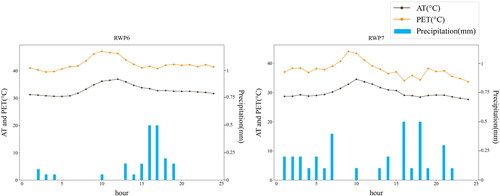
Figure 15. Changes in sensible heat and latent heat over one day under RWP6 and RWP7.
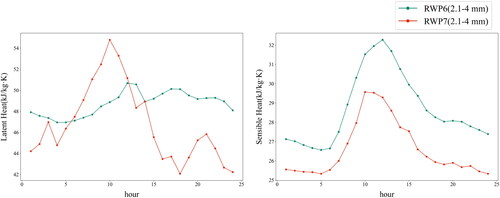
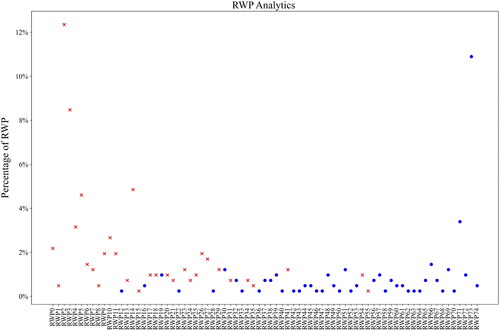
Figure 16. Percentages of RWP0 to RWP74.
Data availability
The data that support the findings of this study are available in [CWA Observation Date Inquire Service] at [https://codis.cwa.gov.tw/], reference number [7]. These data were derived from the following resources available in the public domain: [https://codis.cwa.gov.tw/].