
Figures & data
Figure 1. Location map of the study area: (a) India, (b) West Bengal and (c) Jhargram district.
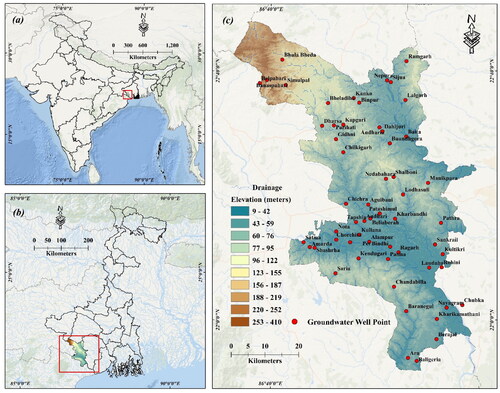
Figure 2. Graphical framework of methodology flow chart.
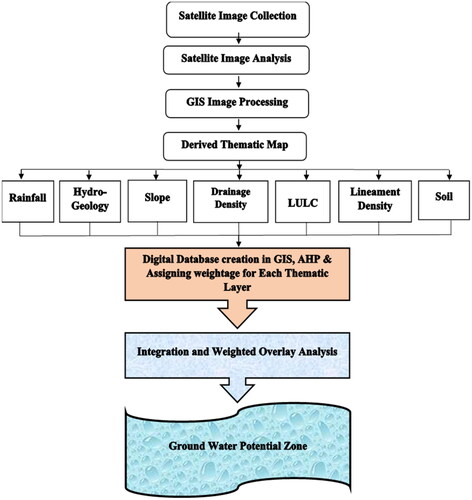
Table 1. Sources of data used for preparing thematic layers.
Table 2. Pairwise comparison matrix for climatic – morphometric – lithologic (CML) indicators at level one (1) decision Hierarchy model.
Figure 3. Groundwater potential zone parameters: (a) slope, (b) drainage density, (c) lineament density, (d) annual rainfall, (e) LULC, (f) soil category and (g) Hydro geology.
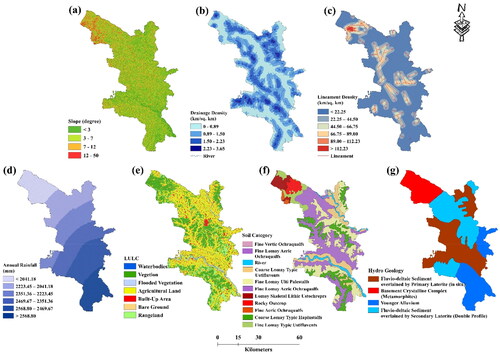
Table 3. Ranking sub-categories for various conditioning factors and assigning weightages based on these rankings.
Figure 4. Map showing the spatial distribution of groundwater potential zones in Jhargram district.
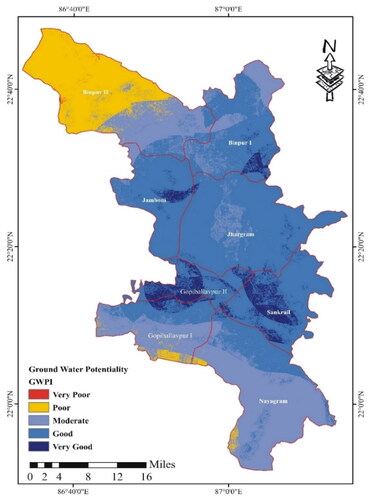
Figure 5. (a) Spatial autocorrelation report, (b) zone of hot spot and cold spot.
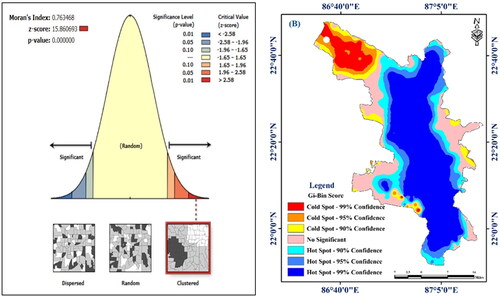
Figure 6. Water column map with well distribution in Jhargram district.
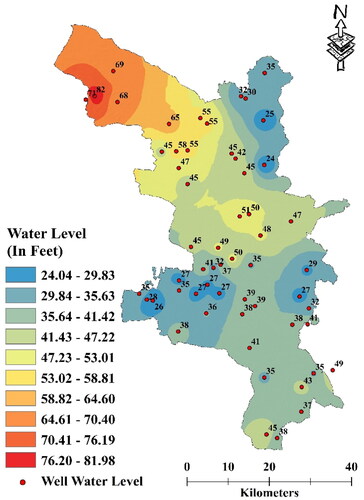
Figure 7. Receivers operating characteristic (ROC) curve showing the accuracy of the present study.
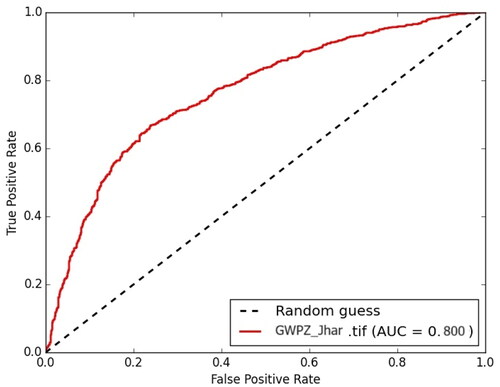
Table 4. Water level data below ground level in feet (fbgl) of some selected stations.
Supplemental Material
Download MS Word (21.8 KB)Data availability
Data available on request from the authors.