Figures & data
Figure 1. Flowchart of the method used.
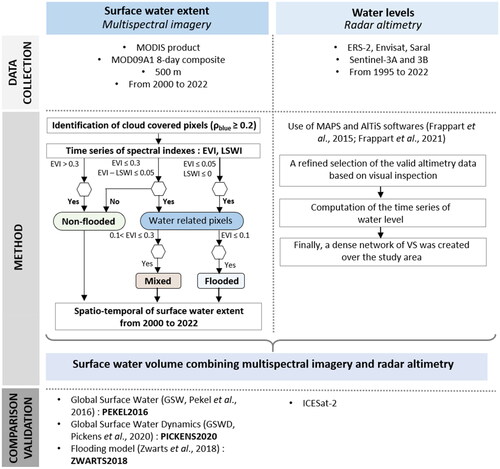
Figure 2. Inner Niger Delta (IND) study site and location of main cities. In situ station (black circles), ERS-2/Envisat/Saral missions (purple triangles), Sentinel-3A (green crosses) and Sentinel-3B (black crosses) are represented on the map. The Niger and Bani rivers are in blue. Flow direction is indicated by blue arrows. The bottom of the map is the digital elevation model Shuttle Radar Topography Mission (SRTM, freely available on NASA website).
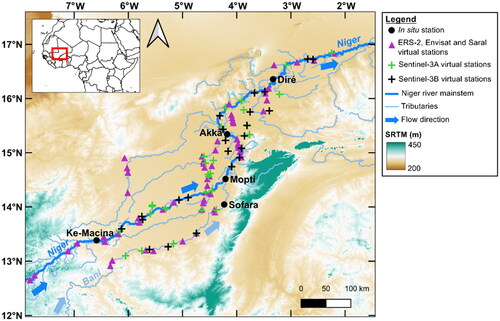
Table 1. Satellite products used in the study.
Figure 3. Time series of surface water extent (km2) calculated using NORMANDIN2018, ZWARTS 2018, PEKEL2016 and PICKENS2020.
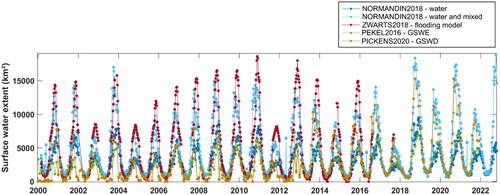
Figure 4. Mean flooding duration using the five methods. (a) from NORMANDIN2018 (with mixed pixels, (b) from NORMANDIN2018 (with mixed pixels), (c) from ZWARTS2018, (d) from PEKEL2016, and (e) from PICKENS2020.
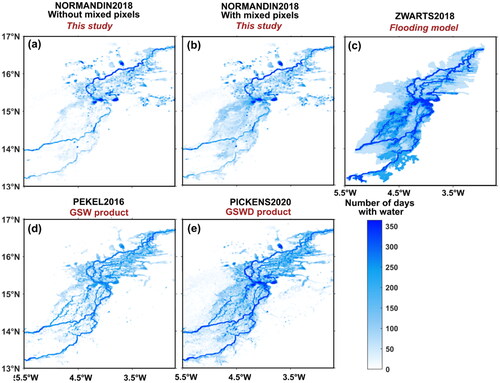
Figure 5. Comparison of water level maps from NORMANDIN2018 and ICESat-2, ZWARTS2018 and ICESat-2. For each comparison, (a) N is the number of samples compared averaged used for each comparison, (b) is the determination coefficient R2, (c) is the Root mean Square Error (RMSE) in meters and (d) is the bias in meters.
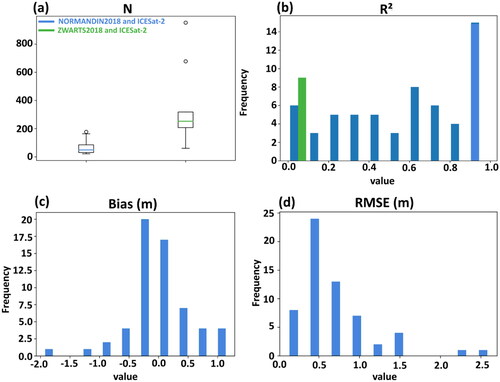
Figure 6. Comparison of water levels measured (m) by ICESat-2, NORMANDIN2018 and ZWARTS2018 along two altimeter tracks, (a) map of the locations of the two altimetry tracks chosen, (b) water levels according to the latitude in the downstream and (c) according to the upstream. For each figure, ICESat-2 points are shown in blue, NORMANDIN2018 in green and ZWARTS2018 in black. For each comparison between ICESat-2 and NORMANDIN2018, N, R2 and bias are displayed in green and in black for ICESat-2 and ZWARTS2018 comparison.
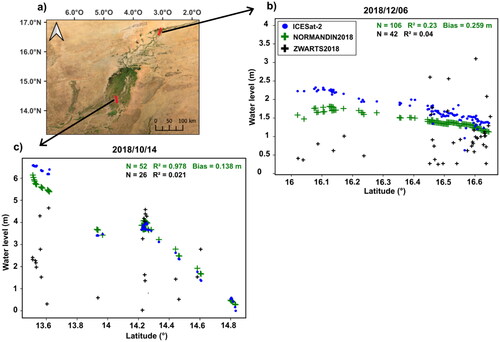
Figure 7. Maps of statistical parameters for the water level maps from NORMANDIN2018 (combining surface water extent and radar altimetry) with ICESat-2 data, superimposed on a Google Earth image from ESRI world imagery in QGIS software. (a) N is the number of samples compared, (b) the determination coefficient R2, (c) the Root mean Square Error (RMSE, in meters) and (d) the bias (in meters).
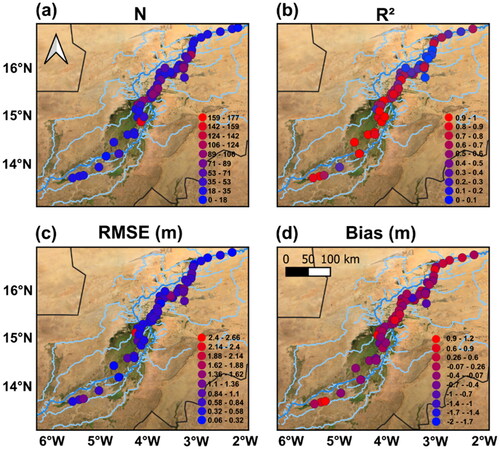
Figure 8. Time series of surface water volume (km3) calculated using NORMANDIN2018, ZWARTS2018 PEKEL2016 and PICKENS2020 methods.
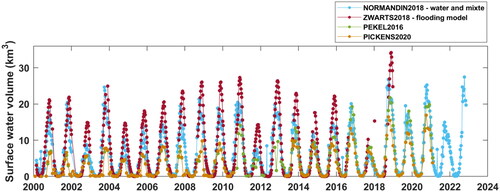
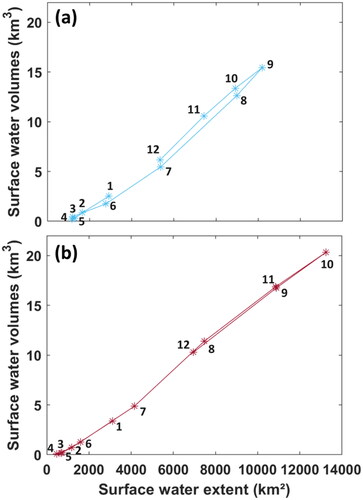
Figure 9. Mean seasonal cycle between surface water extent (km2) and surface water volume (km3) using (a) NORMANDIN2018 and (b) ZWARTS2018. The numbers represent the month of the year.