
Figures & data
Figure 1. A map showing the location of the study area (Syferkuil Farm) in Limpopo Province, Mankweng Township.
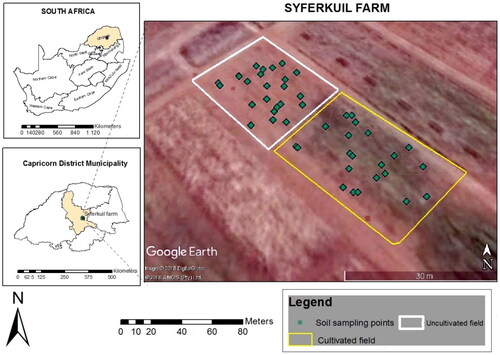
Figure 2. (A) Raw soil reflectance spectra, (B) raw soil spectra with noisy ends removed, (C) first derivative (FD) and (D) second derivative (SD).
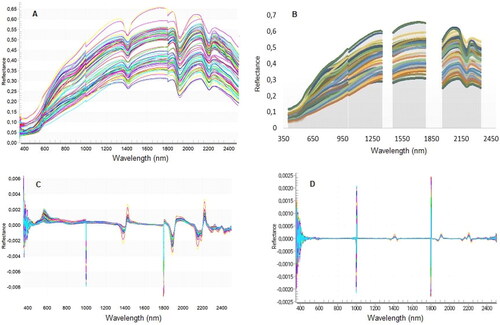
Table 1. A table showing correlation coefficient interpretation.
Table 2. A table of descriptive statistics of NPK nutrient content of the soil in sykerfuil farm.
Figure 3. Pearson correlation between (a) N, (b) K, (c) P and spectral data.
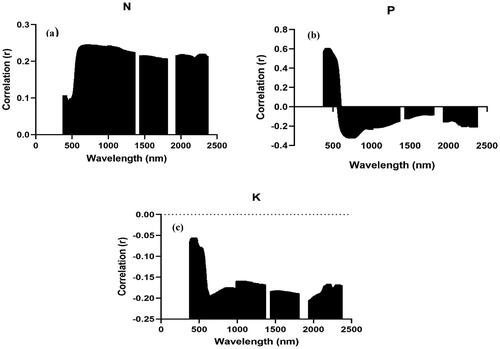
Table 3. Table showing SMLR model performance for the prediction of NPK soil content based on raw spectral data (RD), first derivative (FD) and second derivative spectra (SD).
Table 4. PLSR model performance for the prediction of NPK soil content based on raw spectral data (RD), first derivative (FD) and second derivative spectra (SD).
Figure 4. Important wavelength plots for predicting soil N (a- c), P (d-f) and K (g – i) based on various spectral transformations, PLSR model, Variable Importance projection (VIP) and the b-coefficients.
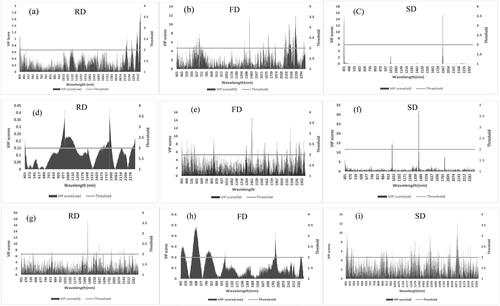
Figure 5. Biplot of the principal components (PC1 -PC3) (red) and scores (black) for the relationship between soil NPK and soil reflectance spectra.
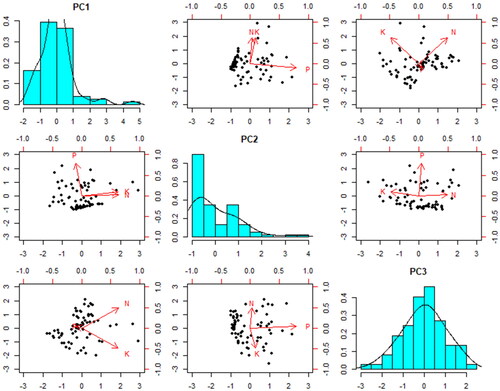
Table 5. Explained and the accumulated explained variances of the first three principal components of soil reflectance spectra.
Data availability statement
The data that support the findings of this study are available from the corresponding author, [FM], upon reasonable request.