
Figures & data
Figure 1. Location of the Pingzhai Reservoir.
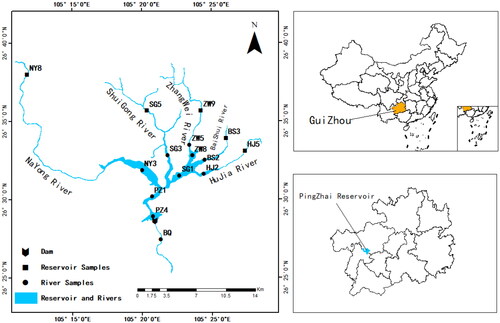
Table 1. Parameters for each band of the Sentinel-2.
Figure 2. BP neural network building process.
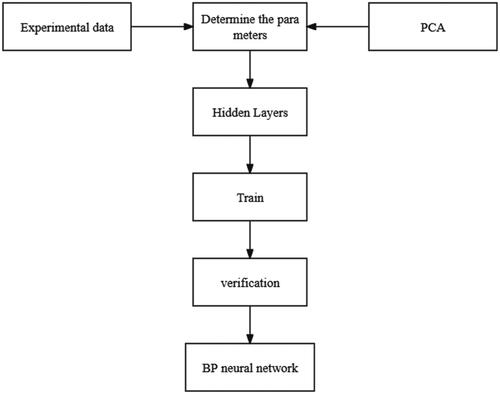
Figure 3. Pearson correlation coefficients of sentinle-2 1-8 bands with TOC concentrations.
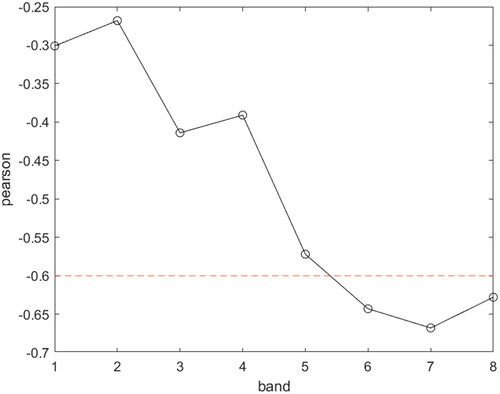
Table 2. Pearson’s correlation coefficients of single band and band combinations with TOC concentrations.
Table 3. TOC concentration inversion empirical model parameters.
Table 4. Comparison of BPNN and quadratic TOC concentration inversion modeling results.
Figure 4. Scatterplot of simulated values of BPNN versus quadratic TOC concentration inversion models.
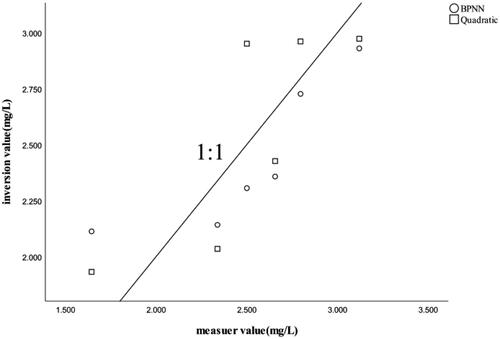
Figure 5. BPNN TOC concentration inversion model simulation results.
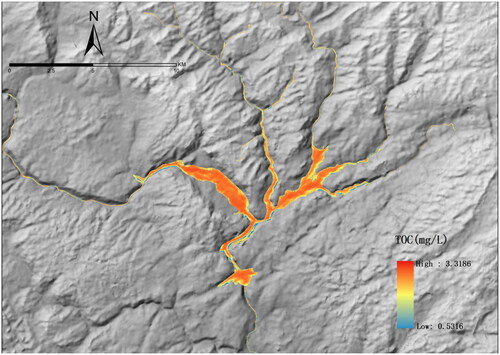
Table 5. Correlation of TOC concentration with other water quality parameters.