
Figures & data
Figure 1. Typical cross section of a four-layout urban road.
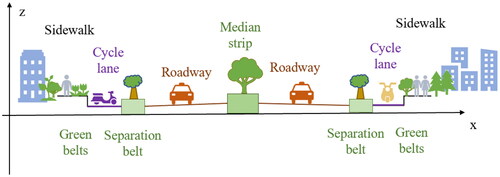
Figure 2. Structure of urban road features.
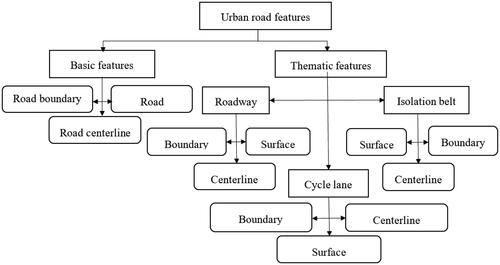
Figure 3. Flowchart of the proposed approach.
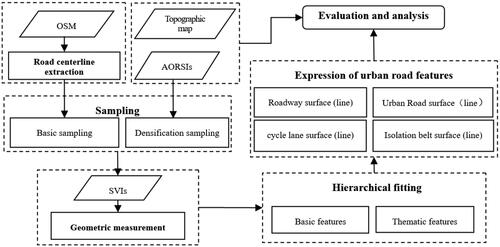
Figure 4. Experimental area and data.
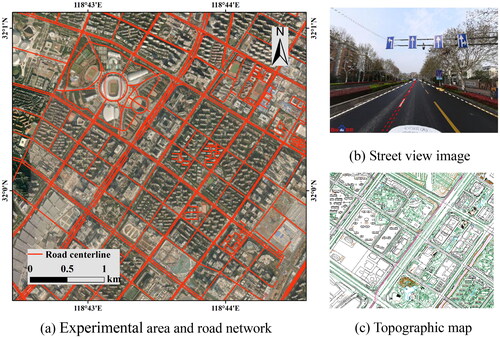
Figure 5. Sampling approach of urban road features.
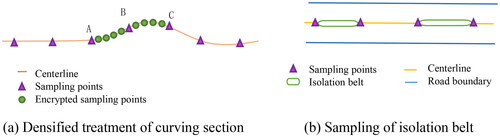
Figure 6. Principle of geometric measurement.
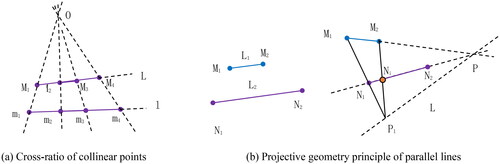
Figure 7. Fitting of road features.
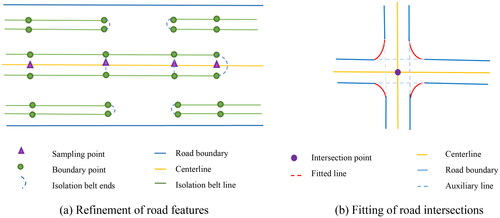
Figure 8. Extraction of road centreline and sampling results.
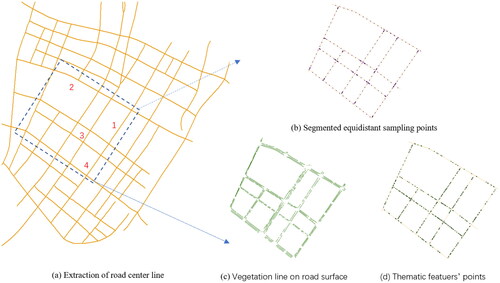
Table 1. Width measurement and error statistic of the No.1 road.
Figure 9. Results of road feature delineation. Blue is the boundary line of urban road, orange is the centreline, and green is the boundary line of isolation belt.
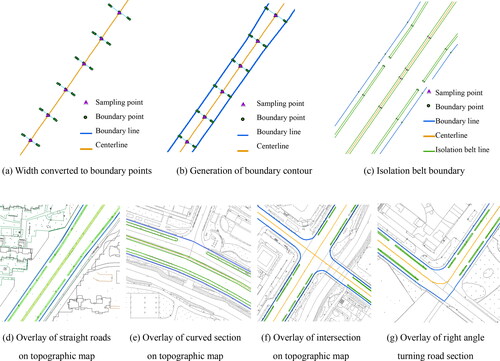
Figure 10. Extraction results of road feature.
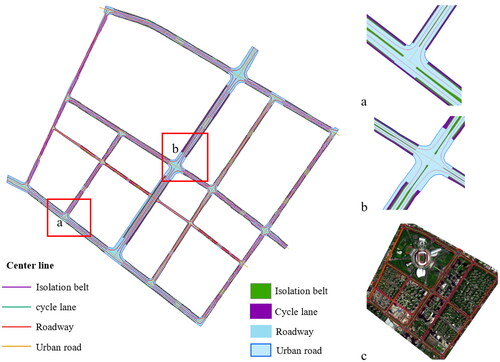
Table 2. Accuracy statistics table of urban road.
Figure 11. Methods comparison.
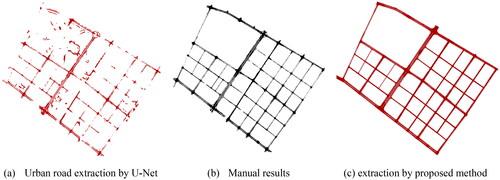
Table 3. Accuracy comparison.
Table 4. Comparison of the refinement degree of urban road element extraction.
Data availability statement
We would like to thank to OpenStreetMap (https://www.openstreetmap.org) for road network and Baidu (https://lbsyun.baidu.com/) for street view images. We are also thankful to the Amap (https://lbs.amap.com/) and Bigmap (http://www.bigemap.com/) for providing us the AORSIs data. Due to confidentiality agreements, the 1:1000 large scale topographic map data can only be made available to bona fide researchers subject to a nondisclosure agreement. Details of the data and how to request access are available from authors.