
Figures & data
Table 1: Modal parameters
Fig. 1: Lateral (in m), vertical (in m), and torsional (in degrees) components of selected modal shapes
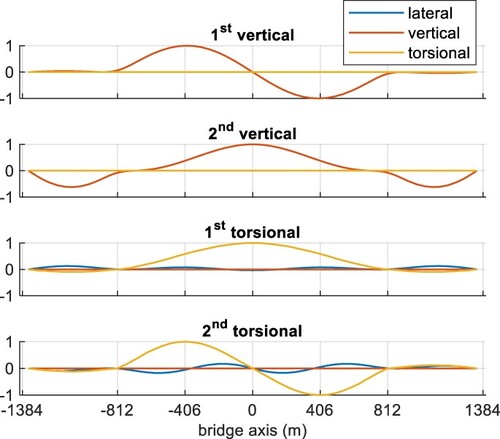
Table 2: Incoming wind characteristics
Fig. 2: Position of the 90 sections at deck level along the bridge axis (red lines)
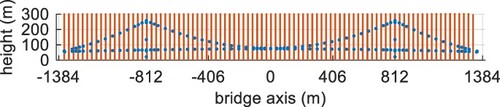
Fig. 3: Sign conventions
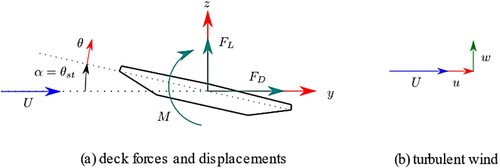
Fig. 4: Static aerodynamic coefficients as a function of the angle of attack
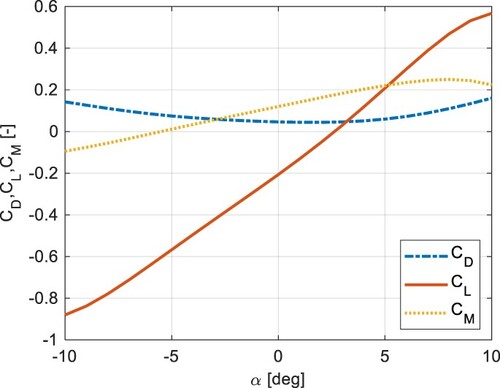
Fig. 5: Lift and moment flutter derivatives as a function of reduced velocity U*, for several mean angles of attack. The markers at U* = 20 indicate the quasi-steady values of the coefficients
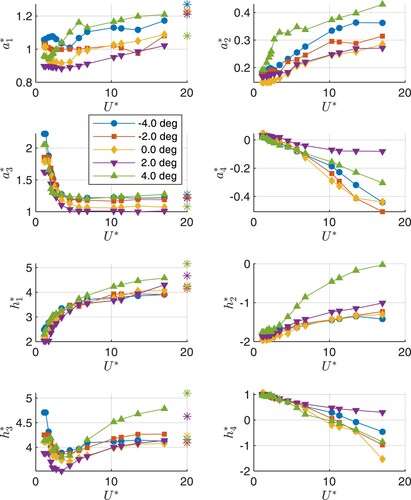
Table 3: Drag and lateral flutter derivative values based on QST, for several angles of attack
Fig. 6: Flutter critical wind speed results from different programmes of the TG
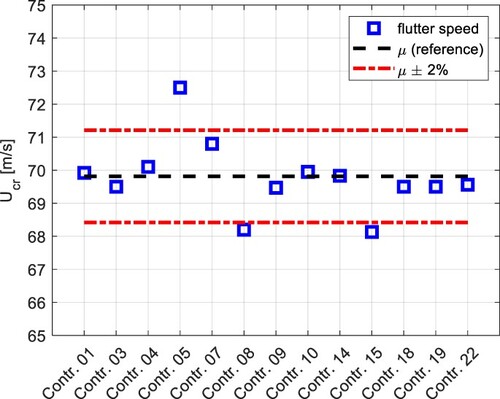
Fig. 7: Total damping ratio of the unstable 1st torsional mode as a function of mean wind speed
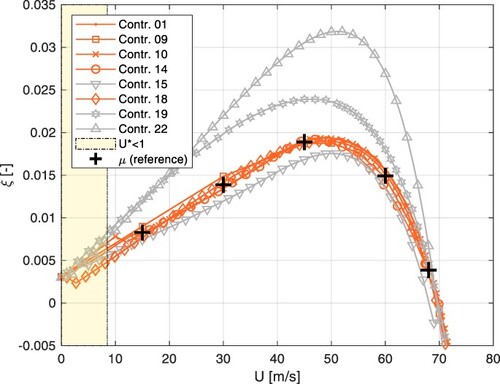
Table 4: Estimated values and spread of the total damping trend
Fig. 8: STD of lateral displacement at mid-span versus mean wind speed
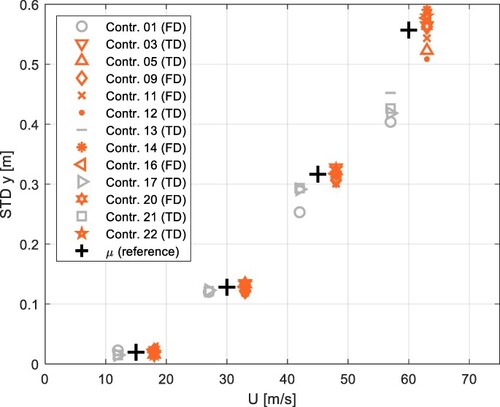
Fig. 9: STD of vertical displacement at mid-span versus mean wind speed
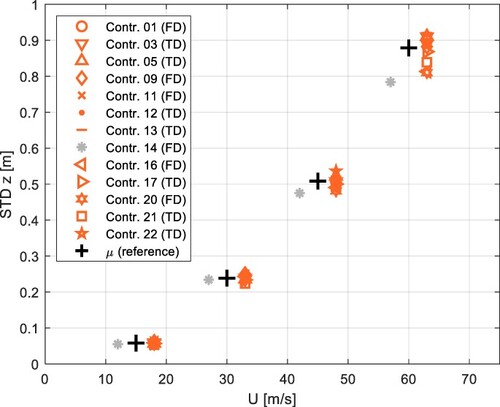
Fig. 10: STD of equivalent torsional displacement at mid-span versus mean wind speed
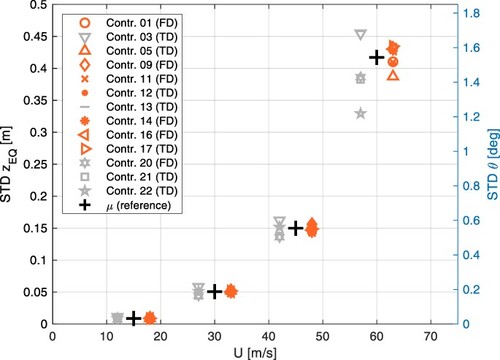
Fig. 11: STD of lateral displacement at quarter-span versus mean wind speed
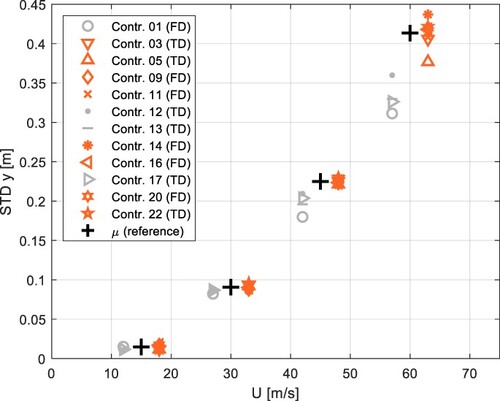
Fig. 12: STD of vertical displacement at quarter-span versus mean wind speed
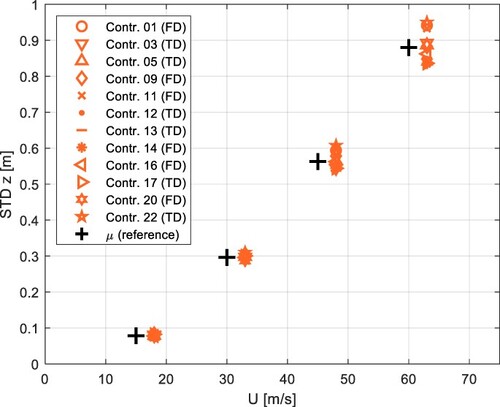
Fig. 13: STD of equivalent torsional displacement at quarter-span versus mean wind speed
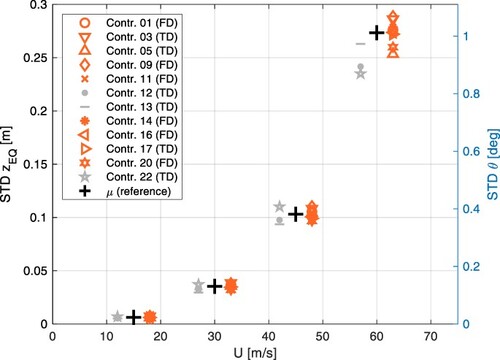
Table 5: Estimated values and spread of the accepted contributions for mid-span and quarter-span
Fig. 14: PSD of the vertical displacement at mid-span at 45 m/s of wind mean speed
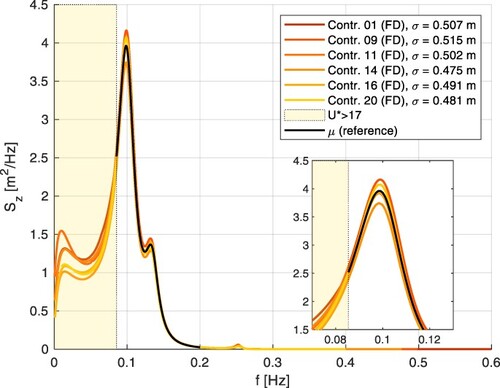
Fig. 15: PSD of the equivalent torsional displacement at quarter-span, at 45 m/s of wind mean speed
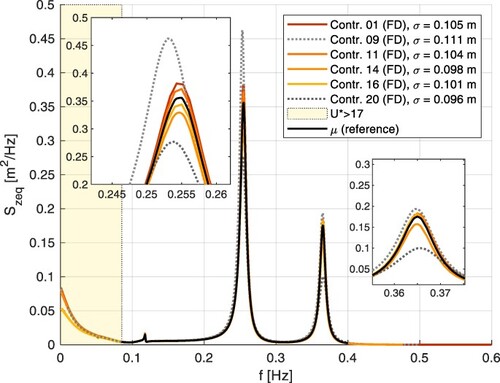
Fig. 16: Time histories of the vertical displacement z and of the rotation θ at mid-span, at 45 m/s
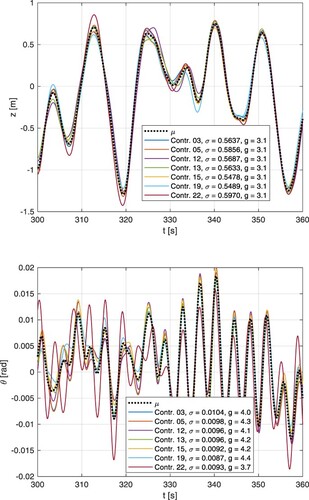
Fig. 17: Comparison metrics for the vertical displacements (left) and for the rotations (right) at mid-span, at 45 m/s
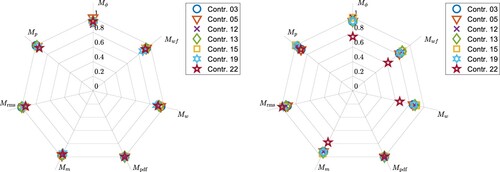
Fig. 18: Static rotation at mid-span versus mean wind speed
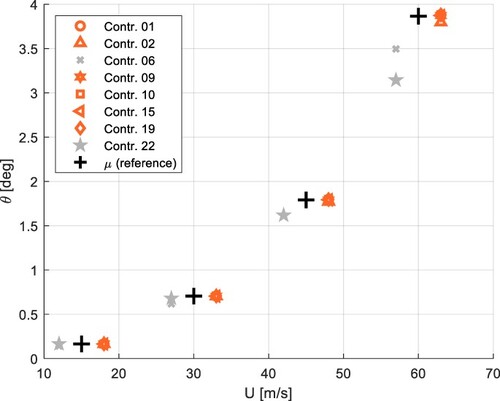
Table 6: Estimated values and spread of the deck static rotation at mid-span
Fig. 19: STD of lateral displacement at mid-span versus mean wind speed
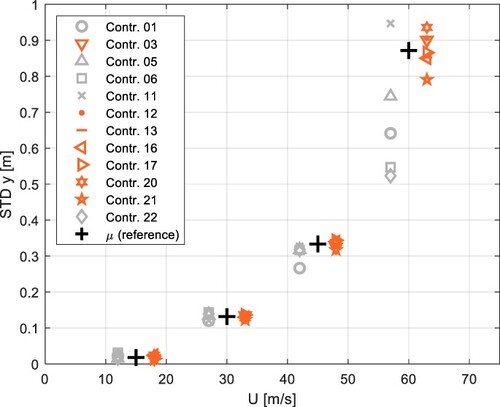
Fig. 20: STD of vertical displacement at mid-span versus mean wind speed
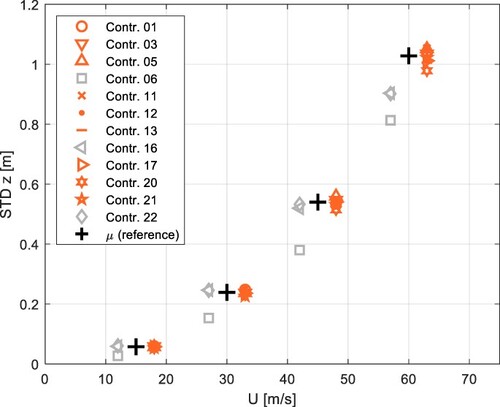
Fig. 21: STD of equivalent torsional displacement at mid-span versus mean wind speed
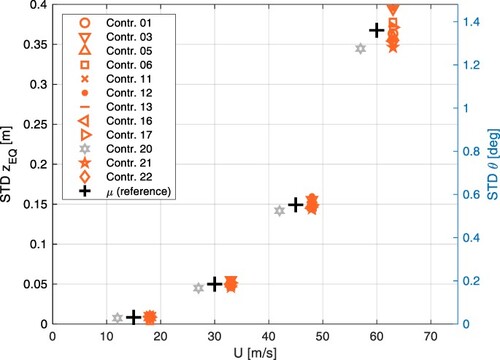
Table 7: Estimated values and spread of accepted contributions for mid-span