
Figures & data
Fig. 1: Partially sheared rectangular thin plate
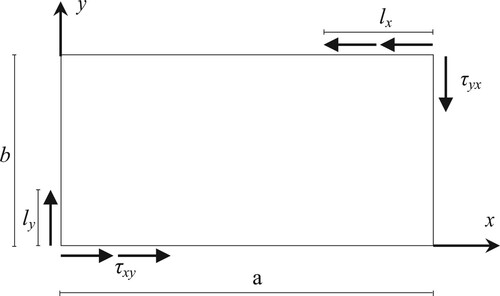
Table 1: Comparison between τcr values obtained analytically and those obtained in the present work
Fig. 2: Variation of the linear critical shear buckling stress versus load aspect ratio α for different plate aspect ratios β
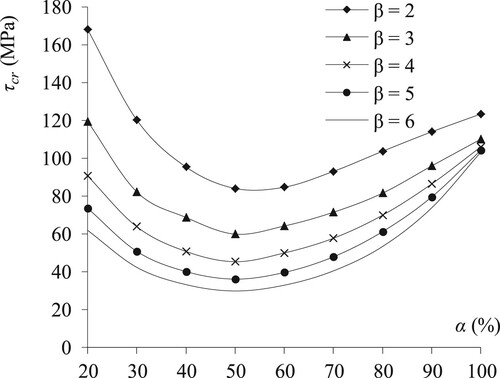
Table 2: Critical linear buckling stress obtained from the different mesh discretizations
Fig. 3: Variation of critical buckling load (linear and nonlinear) τcr versus α ratio for plate with β = 2
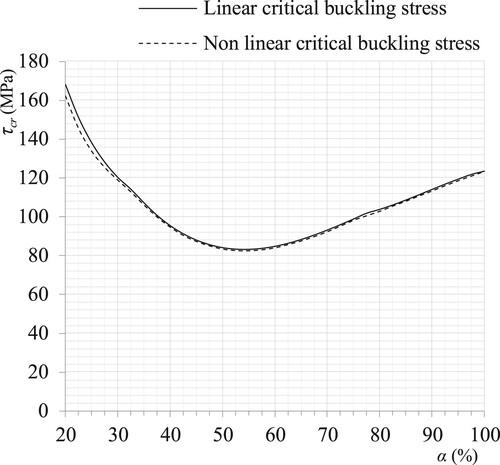
Fig. 4: Variation of shear stress versus displacement wmax for plate with β = 2 and α = 20%, 40%, 60%, 80% and 100%
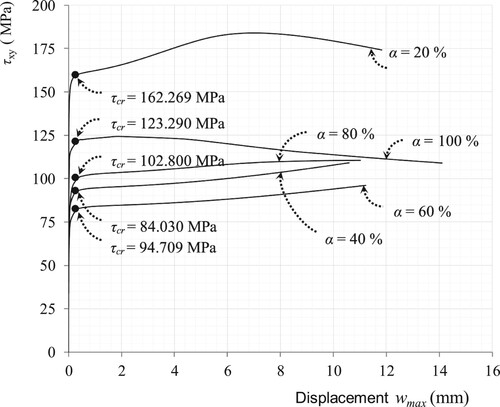
Table 3: The compressive and shear stress values (σc max, σc min, τxy) for a plate with β = 2 and α = 40%
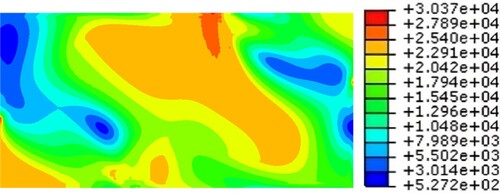
Fig. 5: Nonlinear shear stress (10−2 MPa) distribution throughout a plate specimen with β = 2 and α = 40%
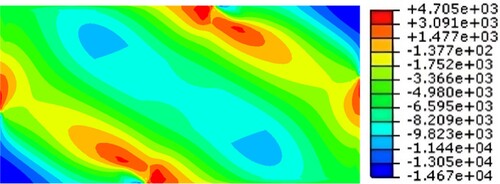
Fig. 6: Plate under shear loading and Fig. 7. Equivalent plate under shear loading
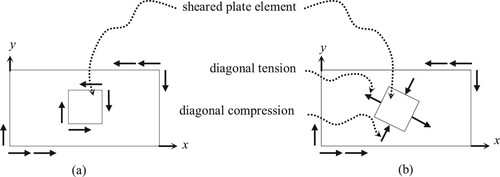
Fig. 8: Nonlinear von Mises stress (10−2 MPa) distribution at the first plasticization on a buckled plate specimen with β = 2, α = 40% and τxy = 94.709 MPa
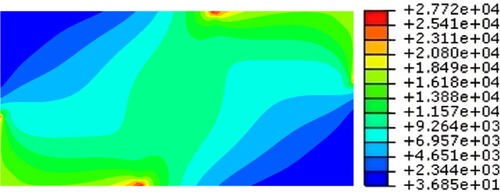
Fig. 9: Nonlinear maximum von Mises stress (10−2 MPa) distribution throughout a plate specimen value reached step with β = 2, α = 40% and τxy = 131.507 MPa
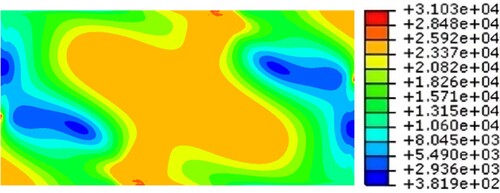
Fig. 10: Nonlinear von Mises stress (10−2 MPa) distribution throughout a buckled plate specimen a few steps after reaching the maximum value with β = 2, α = 40% and τxy = 124.765 MPa
Data Availability Statement
The data that support the findings of this study are available from the first named author, upon reasonable request. Any such requests should be made by emailing the first named author directly.