
Figures & data
Table 1. Comparison of Malaysia’s defence government R&D budgetFootnote1.
Table 2. Comparison of Malaysia’s defence R&D allocation against various countries.
Table 3. Selective country-specific researcher distribution (Per Million People).
Table 4. STRIDE Researchers Compared to Various Defence Research Agencies.
Figure 1. An MIT Approach to Innovation: ecosystems, capacities & stakeholders. Source: Budden and Murray (Citation2019), pp. 7.
Figure 2. The Defence Research and Development Stakeholder Engagement Framework (DRDSEF. Source: Authors.
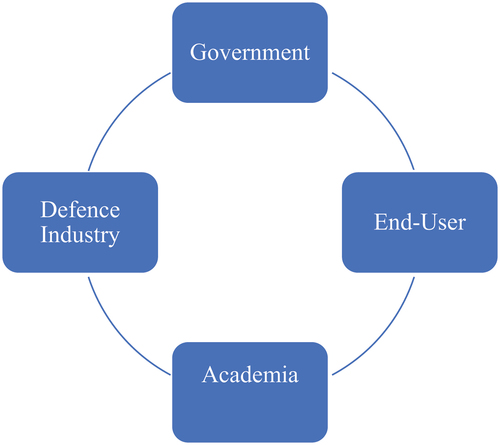
Table 5. Roles and position of the interview participants.
Table 6. STRIDE Personnel Breakdown.
Table 7. Examples of defence R&D collaboration by the MDI companies.