Figures & data
Figure 1 Mad2 expression in PGI-DLBCL. (A) Immunohistochemical staining of Mad2. PGI-DLBCL (stomach) (400×). Mad2 was stained in the cytoplasm and nucleus of tumor cells. (B) Positive control for Mad2 expression. Normal tonsil (200×). Mad2 was mainly expressed in the germinal center. (C) Negative control for Mad2 staining. PGI-DLBCL (stomach) (400×). (D) Statistic analysis of Mad2 expression in PGI-DLBCL. A PGI-DLBCL. B Reactive lymph node (germinal center). C Reactive lymph node (non-germinal center). D Normal gastrointestinal tissue (lymphoid nodule). E Nodal lymphoma of DLBCL. (※) B–D P < 0.01, (#) E P > 0.05.
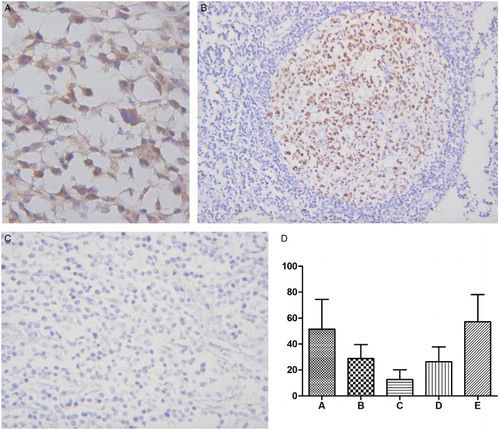
Figure 2 Ki-67 expression in PGI-DLBCL (ileum) (400×). Ki-67 was localized to the nucleus of PGI-DLBCL cells.
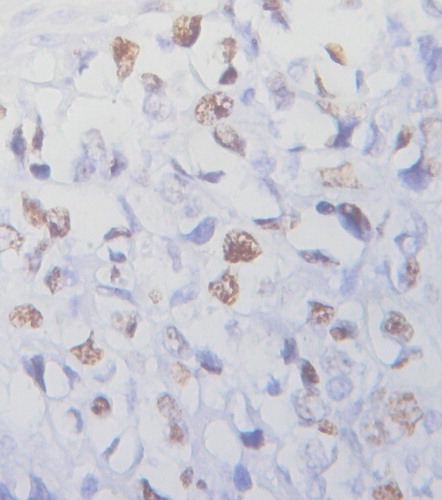
Figure 3 BCL-6 gene rearrangement in PGI-DLBCL cells (ileocecal) (400×). In normal cell hybridized with the BCL-6 probe, the expected signal pattern is two red and green fusion signals (2F). Nucleus with a translocation breakpoint involving the BCL-6 gene showing a one red, one green, and one fusion (1R1G1F) pattern.
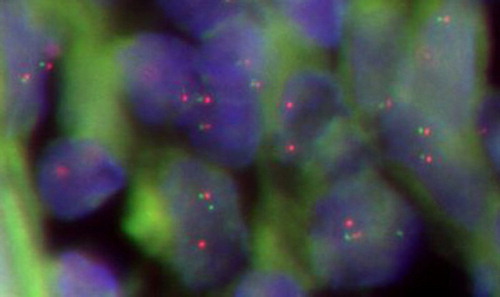
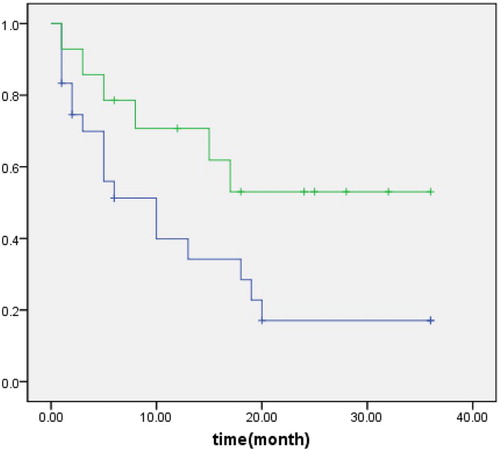
Figure 4 Disease-free survival of patients with PGI-DLBCL. Upper line: low Mad2 expression; lower line: high Mad2 expression.