952
Views
8
CrossRef citations to date
0
Altmetric
Thalassemia

Identification and molecular characterization of a novel 163 kb deletion: The Italian (ϵγδβ)0-thalassemia

, , , , & ORCID Icon

Figures & data

Figure 1 Molecular characterization of the Italian (ϵγδβ)0-thalassemia and comparison with others’ deletions. (A) MLPA analysis of the new deletion. Ratio between the values obtained from the proband and normal subjects: the position of the different probes on the beta-globin gene cluster is indicated on the x-axis. Shown in gray are the probes with half dosage and in black, the probe with full dosage. (B) Quantitative real-time PCR analysis (primers in Table ) probing the regions not tested by MLPA: 12 fragments (gray diamonds) show half dosage and seven fragments (black diamonds) show full dosage. The localization of MLPA fragments 28, 27, and 1 is shown. (C) Scheme of the beta-globin gene cluster with location of the MLPA probes (indicated with numbers) and of the quantitative real-time PCR fragments (indicated with small letter in italic); the s and a fragments are at 5′ and 3′ arm of depicted region. Genes are indicated by filled rectangles; pseudo gene is indicated by an empty rectangle; DNA hypersensitive sites (HS) are indicated by empty triangles. The positions of the LINE element and of the 160-bp palindrome are reported in the section repeat elements. The position of the Italian (ϵγδβ)0-thalassemia deletion (gray bar), of the Chilean (ϵγδβ)0-thalassemia deletion (most similar), and of three deletions with 5′ breakpoints localized in the LINE element are indicated by thick lines.

Figure 1 Molecular characterization of the Italian (ϵγδβ)0-thalassemia and comparison with others’ deletions. (A) MLPA analysis of the new deletion. Ratio between the values obtained from the proband and normal subjects: the position of the different probes on the beta-globin gene cluster is indicated on the x-axis. Shown in gray are the probes with half dosage and in black, the probe with full dosage. (B) Quantitative real-time PCR analysis (primers in Table 1) probing the regions not tested by MLPA: 12 fragments (gray diamonds) show half dosage and seven fragments (black diamonds) show full dosage. The localization of MLPA fragments 28, 27, and 1 is shown. (C) Scheme of the beta-globin gene cluster with location of the MLPA probes (indicated with numbers) and of the quantitative real-time PCR fragments (indicated with small letter in italic); the s and a fragments are at 5′ and 3′ arm of depicted region. Genes are indicated by filled rectangles; pseudo gene is indicated by an empty rectangle; DNA hypersensitive sites (HS) are indicated by empty triangles. The positions of the LINE element and of the 160-bp palindrome are reported in the section repeat elements. The position of the Italian (ϵγδβ)0-thalassemia deletion (gray bar), of the Chilean (ϵγδβ)0-thalassemia deletion (most similar), and of three deletions with 5′ breakpoints localized in the LINE element are indicated by thick lines.

Table 1 Primers and position of amplicons for quantitative real-time PCR

Figure 2. Molecular characterization of the Italian (ϵγδβ)0-thalassemia. (A) Long-range PCR fragment obtained using the qRT-PCR primers p and c. In the upper part of the normal cluster in the lower line the recombinant cluster. Restriction mapping of the enzymes HindIII, BglII, and SacI are reported. The vertical dashed lines connect the same restriction sites. The length of the anomalous fragments is reported. The position of the primers are indicated with the symbol *; n indicated fragment of normal length. (B) Gap-PCR for the screening of carriers for the Italian (ϵγδβ)0-thalassemia. Lines 1–2: Gap-PCR for the Italian (ϵγδβ)0-thalassemia (1.750 bp); Lines 4–5: PCR for the internal control amplicon (867 bp). Lanes 1 and 4: proband; lanes 2 and 5: normal controls; lane 3: reagent control. (C) Electropherogram of the sequence of the Italian (ϵγδβ)0-thalassemia deletion breakpoint. The LINE sequence in the 5′ and the 160-bp palindrome in the 3′ breakpoint are reported; the microhomology found is in a box. Deletion breakpoints are highlighted with arrows. The nucleotide numbering of the normal sequences, according to reference sequence GRCh37/hg19, is shown.

Figure 2. Molecular characterization of the Italian (ϵγδβ)0-thalassemia. (A) Long-range PCR fragment obtained using the qRT-PCR primers p and c. In the upper part of the normal cluster in the lower line the recombinant cluster. Restriction mapping of the enzymes HindIII, BglII, and SacI are reported. The vertical dashed lines connect the same restriction sites. The length of the anomalous fragments is reported. The position of the primers are indicated with the symbol *; n indicated fragment of normal length. (B) Gap-PCR for the screening of carriers for the Italian (ϵγδβ)0-thalassemia. Lines 1–2: Gap-PCR for the Italian (ϵγδβ)0-thalassemia (1.750 bp); Lines 4–5: PCR for the internal control amplicon (867 bp). Lanes 1 and 4: proband; lanes 2 and 5: normal controls; lane 3: reagent control. (C) Electropherogram of the sequence of the Italian (ϵγδβ)0-thalassemia deletion breakpoint. The LINE sequence in the 5′ and the 160-bp palindrome in the 3′ breakpoint are reported; the microhomology found is in a box. Deletion breakpoints are highlighted with arrows. The nucleotide numbering of the normal sequences, according to reference sequence GRCh37/hg19, is shown.

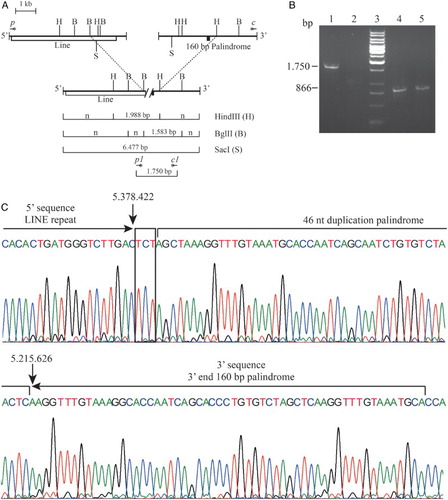
Table 2 Hematological data of the proband and of the current findings in heterozygotes for the ϵγδβ-deletion

Figure 3 Comparison of the HbA2 and Hb values between (ϵγδβ)0-thalassemia and α0- and β0-thalassemia carriers. (A) Histogram of the Hb A2 value of 92 heterozygotes for α0-thalassemia and of the 19 heterozygotes for (ϵγδβ)0-thalassemia from literature. The ranges, averages, and SD of the Hb A2 of the two groups of carriers were reported in a comparative scheme with horizontal overlapping lines. On the left, the number of subjects. (B) Interval plot of the Hb levels of α0-, β0- and (ϵγδβ)0-thalassemia carriers. The Hb level of the (ϵγδβ)0-thalassemia was significantly lower than the others two class of thalassemia carriers.

Figure 3 Comparison of the HbA2 and Hb values between (ϵγδβ)0-thalassemia and α0- and β0-thalassemia carriers. (A) Histogram of the Hb A2 value of 92 heterozygotes for α0-thalassemia and of the 19 heterozygotes for (ϵγδβ)0-thalassemia from literature. The ranges, averages, and SD of the Hb A2 of the two groups of carriers were reported in a comparative scheme with horizontal overlapping lines. On the left, the number of subjects. (B) Interval plot of the Hb levels of α0-, β0- and (ϵγδβ)0-thalassemia carriers. The Hb level of the (ϵγδβ)0-thalassemia was significantly lower than the others two class of thalassemia carriers.
Supplemental material

supplementary_data_February.docx

Download MS Word (126.1 KB)

Reprints and Corporate Permissions

Please note: Selecting permissions does not provide access to the full text of the article, please see our help page How do I view content?

To request a reprint or corporate permissions for this article, please click on the relevant link below:

Academic Permissions

Please note: Selecting permissions does not provide access to the full text of the article, please see our help page How do I view content?

Obtain permissions instantly via Rightslink by clicking on the button below:

If you are unable to obtain permissions via Rightslink, please complete and submit this Permissions form. For more information, please visit our Permissions help page.