Figures & data
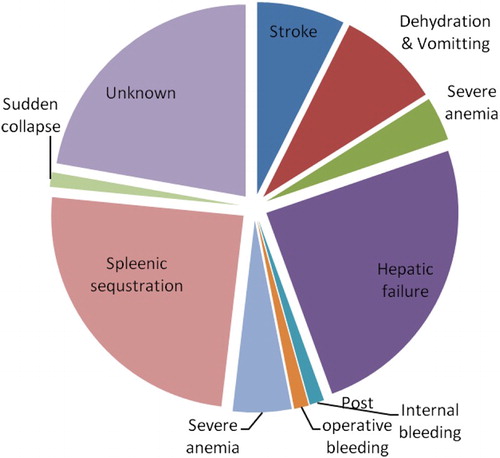
Figure 1 Percent distribution of splenic status in SCD individuals representing non palpable splenomegaly and splenectomy in SCA, SBT, and total SCD groups
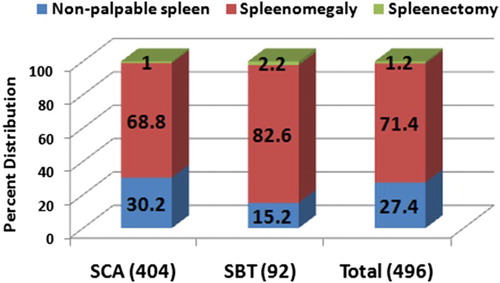
Figure 2 Percent distribution of blood transfusions among three different groups (SCA, SBT, and Total SCD)
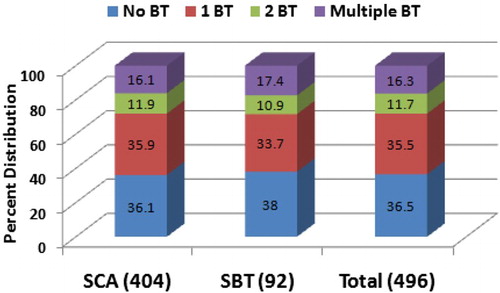
Table 1 Common signs and symptoms observed in SCD patients
Table 2 Haematological profile of SCD patients
Table 3 Comparison of some clinical signs with foetal haemoglobin levels
Table 4 Age at first onset of clinical symptoms in SCD patients
Figure 3 Probable cause of death among SCD patients who died during the study period