Figures & data
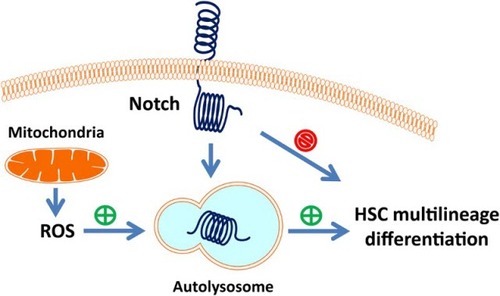
Figure 1 Mitochondrial ROS promotes hematopoietic stem cell differentiation but attenuates Notch signaling. (A) ROS generation is progressively increased during hematopoietic stem cell differentiation (LSK, LK, Lin- and Lin+) measured by flow cytometry. **P < 0.01; ns, P > 0.05. (B) Overlays of mitochondrial membrane potential stained with JC-1 in WT mice LSK, LK, Lin- and Lin+ cells. (C) Indicated cells were stained with 5 μM MitoSOX Red, specific for mitochondrial O2−·, for 15 minutes and then analyzed flow cytometry. Percentage of MitoSox Red positive cells was quantified. **P < 0.01. (D, E) NAC and MitoQ inhibited rapamycin-induced differentiation measured by benzidine staining. Percentage of benzidine-positive cells was quantified (right panel). **P < 0.01; ns, P > 0.05. (F) Comparison of in vitro CFU-C in control and MitoQ treated hematopoietic stem and progenitor cells (LSK) and counted on day 7. The numbers of colonies were quantified (right panel). *P < 0.05. (G) Blood routine examination of peripheral blood form control and NAC treated wild-type mice. *P < 0.05. (H) Cytometric measurement of intracellular Notch protein level in LSK cells isolated from wild-type mice treated with or without NAC. *P < 0.05. (I) qRT-PCR detection of the expression for Notch target genes Hey2 and Cyclin D1 in LSK cells isolated from NAC treated wild-type mice. *P < 0.05; **P < 0.01.
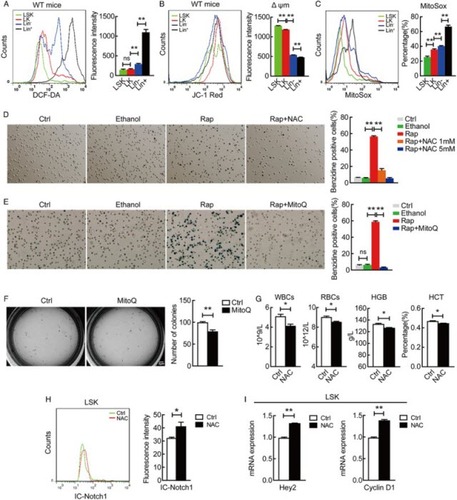
Figure 2 ROS regulates hematopoietic stem cell differentiation in an autophagy-dependent manner. (A) Rapamycin reduced ROS level in wild-type mouse LSK cells, measured by DCF-DA staining. Results were quantified (lower panel). **P < 0.01. (B) Autophagy defect in different stages (LSK, LK and Lin+) of hematopoietic hierarchy caused elevated ROS generation and different response to NAC treatment. *P < 0.05; **, P < 0.01; ns, P > 0.05. (C) qRT-PCR detection of the expression for autophagy-essential genes in LSK cells isolated from NAC treated or not treated wild-type mice. *P < 0.05; **P < 0.01. (D) NAC reduced the percentage of CD11b and Ly6G-Ly6C bone marrow cells in wild-type, not Atg7−/− mice, measured by flow cytometry. **P < 0.01, *P < 0.05. (E) Autophagy defect impaired multilineage differentiation and caused a failure in response to NAC treatment. Wild-type and Atg7−/−mice were treated with or without NAC, and peripheral blood was counted **P < 0.01; ns, P > 0.05. All experiments were repeated at least three times. n ≥ 5.
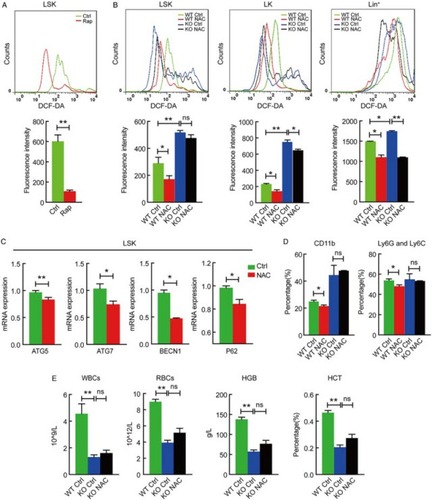
Figure 3 A cartoon illustrating ROS regulation of HSC differentiation. ROS generated in the mitochondria acts as an upstream signal to activate autophagy, and autophagy in turn targets intracellular Notch, thereby relieving its suppression on hematopoietic stem cell multilineage differentiation.