Figures & data
Table 1 Patients’ characteristics
Figure 1 Treatments after a period at constant IM dose
Figure 2 Sequential evaluations of BCR–ABL level in three of the five patients who discontinued IM for at least 12 months and who are still off treatment. For clarity, patients 51 and 74 have not been included in the graph because all their readings are zero
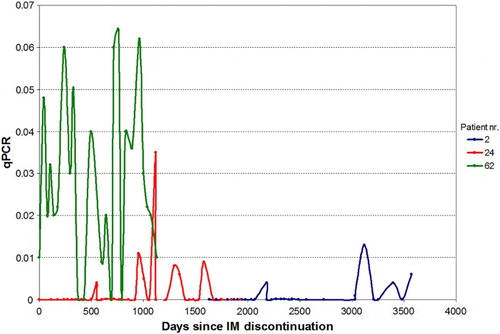
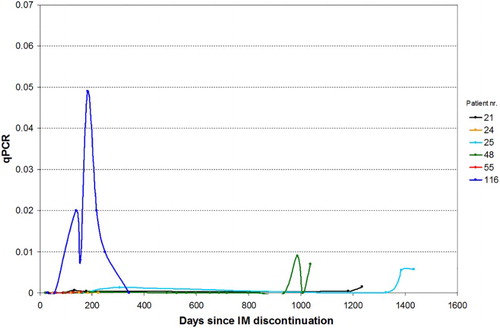
Figure 3 Sequential evaluations of BCR–ABL level in six patients who discontinued IM for at least 12 months and who then re-started treatment. Patients with only one qPCR measurement have not been included in the graph