Figures & data
Table 1 The basic parameters of MDS patients according to their WHO classification
Figure 1 LPI and ASF of MDS patients during DFO treatment. LPI has a statistical difference (P < 0.001 by ANOVA), which decreased gradually, among three groups, while no difference was found in ASF (P = 0.086 by ANOVA)
Table 2 Iron biochemical parameters in MDS patients
Figure 2 The correlation between LPI and LIC, ASF and LIC of MDS patients during DFO treatment. On week 0 and week 26, we used MRI T2* to test LIC in MDs patients, while their LPI and ASF were tested at the same time. We put data together (week 0 + week 26) to perform a linear regression to analyze the correlation between LPI and LIC, ASF and LIC. As Fig. shows, LPI has a closer connection to LIC than ASF (r = 0.739, P < 0.001 vs. r = 0.321, P = 0.034)
Table 3 Clinical parameters in MDS patients
Figure 3 DCF and erythroid apoptosis rate of MDS patients during DFO treatment. With the decrease of LPI, DCF and erythroid apoptosis rate both reduced. Figure shows the changes of one patient's DCF and erythroid apoptosis rate, whose DCF decreases from 72.17 to 40.16 and erythroid apoptosis rate from 42.60 to 18.05%
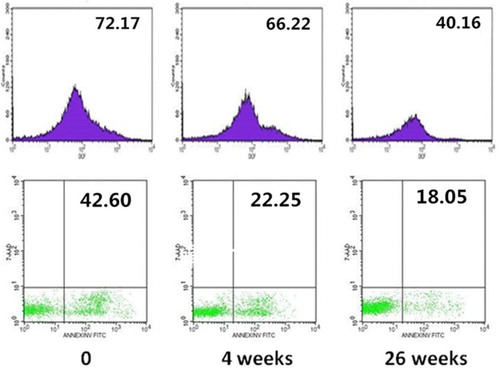
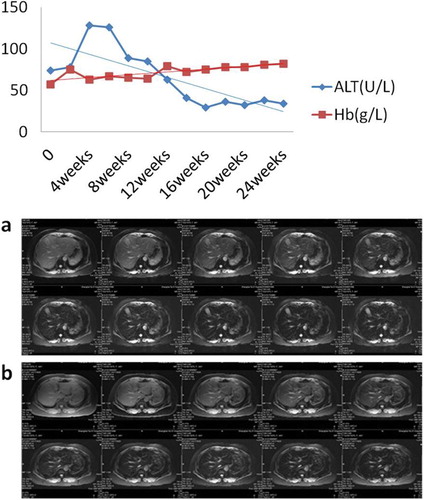
Figure 4 The improvement of ALT, hemoglobin, and LIC. Before DFO treatment, a patient had an abnormal liver function. Along with iron chelation therapy, his LPI decreased rapidly. Meanwhile, his ALT dropped and his hemoglobin increased gradually. Furthermore, his LIC decreased after receiving DFO treatment. Lane a: LIC was 9.97 mg/g dry weight on week 0. Lane b: LIC was 5.81 mg/g dry weight on week 26