1,974
Views
1
CrossRef citations to date
0
Altmetric
Articles

The preparation, characterization, and application of environment-friendly monoclonal antibodies for human blood cell

, , , , , & show all

Figures & data

Figure 1 Cell growth curve and antibody productivity. The counted cell number of clone 51A8 (A) and 68B6 (B) in 600 ml medium (indicated as solid circle) and measured anti-A (A) or anti-B (B) antibody titer (indicated as solid square) of the culture supernatants everyday were plotted. Bar represents standard deviation (SD) of three parallel samples.
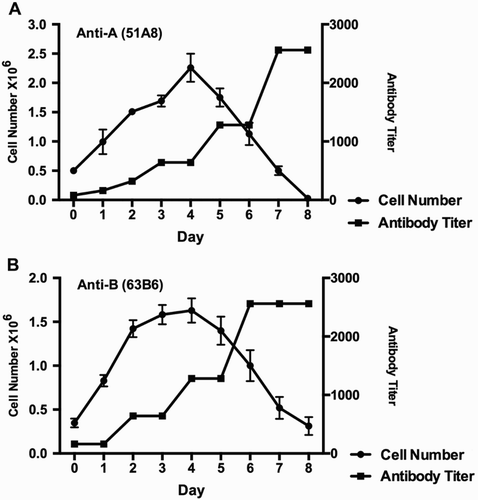
Figure 1 Cell growth curve and antibody productivity. The counted cell number of clone 51A8 (A) and 68B6 (B) in 600 ml medium (indicated as solid circle) and measured anti-A (A) or anti-B (B) antibody titer (indicated as solid square) of the culture supernatants everyday were plotted. Bar represents standard deviation (SD) of three parallel samples.

Figure 2 Longitudinal and accelerated stability test of anti-A (51A8) and anti-B (63B6) reagents. A longitudinal test for 2 years at 2–8°C. (B) Accelerated test for 3 weeks at 37°C. (C) Accelerated test for 3 weeks at 43°C. (D) Freeze–thaw test between −70 and 37°C.
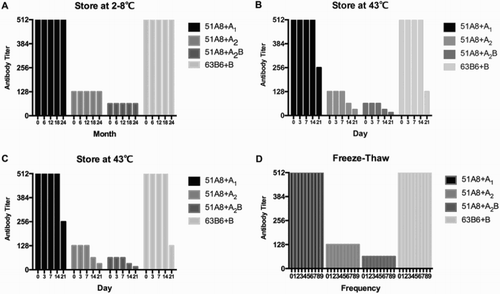
Figure 2 Longitudinal and accelerated stability test of anti-A (51A8) and anti-B (63B6) reagents. A longitudinal test for 2 years at 2–8°C. (B) Accelerated test for 3 weeks at 37°C. (C) Accelerated test for 3 weeks at 43°C. (D) Freeze–thaw test between −70 and 37°C.

Figure 3 SDS–PAGE analysis of anti-A (51A8) and anti-B (63B6) reagents and other commercial anti-A reagents.
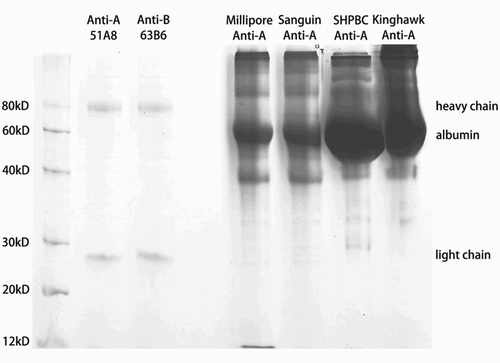
Figure 3 SDS–PAGE analysis of anti-A (51A8) and anti-B (63B6) reagents and other commercial anti-A reagents.

Table 1 Protein quantification of different antibody reagents

Table 2 Agglutination score of anti-A (51A8) and anti-B (63B6) reagents reacted with different RBCs phenotype

Table 3 Titer of anti-A and anti-B reagents from different manufacturers

Figure 4 Histograms of RBCs of ABO antigens tested with anti-A or anti-B antibody reagents and FITC-labeled secondary antibodies. The X and Y-axis represent FITC-derived fluorescence and the number of cells, respectively.

Figure 4 Histograms of RBCs of ABO antigens tested with anti-A or anti-B antibody reagents and FITC-labeled secondary antibodies. The X and Y-axis represent FITC-derived fluorescence and the number of cells, respectively.

Figure 5 The comparison of amino acid sequences of the variable regions of anti-A (51A8) and anti-B (63B6) with that of other published counterpart.Citation17Citation19 (A and B) VH and VL sequences of 51A8 are compared with those of AC12.Citation2 (C and D) VH and VL sequences of 63B6 are compared with those of BC1004.Citation20
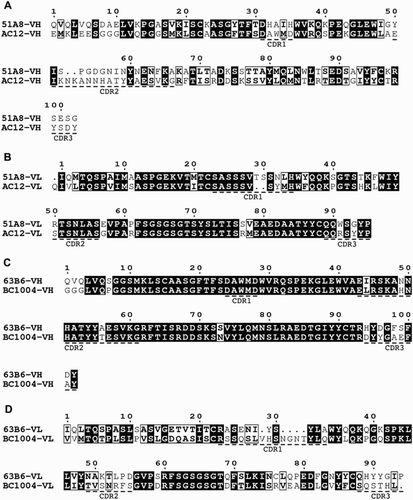
Figure 5 The comparison of amino acid sequences of the variable regions of anti-A (51A8) and anti-B (63B6) with that of other published counterpart.Citation17–Citation19 (A and B) VH and VL sequences of 51A8 are compared with those of AC12.Citation2 (C and D) VH and VL sequences of 63B6 are compared with those of BC1004.Citation20

Table 4 Results of clinical trial of anti-A (51A8) and anti-B (63B6) reagents

Reprints and Corporate Permissions

Please note: Selecting permissions does not provide access to the full text of the article, please see our help page How do I view content?

To request a reprint or corporate permissions for this article, please click on the relevant link below:

Academic Permissions

Please note: Selecting permissions does not provide access to the full text of the article, please see our help page How do I view content?

Obtain permissions instantly via Rightslink by clicking on the button below:

If you are unable to obtain permissions via Rightslink, please complete and submit this Permissions form. For more information, please visit our Permissions help page.