Figures & data
Table 1. Clinical characteristics and laboratory findings of SCD patients and healthy controls.
Figure 1. Representative dot plots showing RBC distribution by forward scatter (FSC) and side scatter (SSC), and histograms showing CD55 and CD59 FITC MFI expressions versus counted cells from RBCs gate. (a) and (b) showing CD55 and CD59 expression on RBCs from healthy control. (c) and (d) showing CD55 and CD59 expression on RBCs from SCD patients, respectively.
Figure 2. Comparison of (a) CD55 deficiency and (b) CD59 deficiency states among healthy controls and SCD patients.
Figure 3. Comparative analysis of the proportion of CD55-deficient (a) and CD59-deficient (b) RBCs from SCD patients and healthy controls.
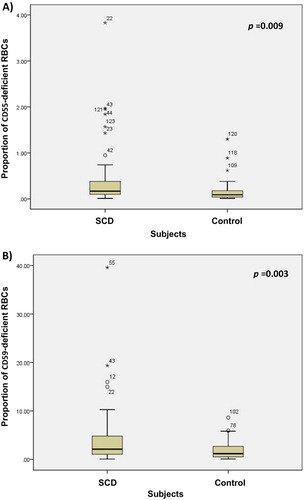
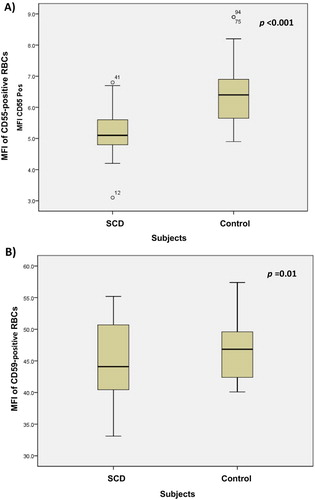
Figure 4. Comparative analysis of the MFI of (a) CD55-positive and (b) CD59-positive RBCs from SCD patients and healthy controls.