1,022
Views
5
CrossRef citations to date
0
Altmetric
Acute Lymphoblastic Leukemia

HFE gene mutation and iron overload in Egyptian pediatric acute lymphoblastic leukemia survivors: a single-center study

, ORCID Icon, &

Figures & data

Figure 1. Agarose gel electrophoresis of (1) amplification product of HFE gene at 387 bp. Lane 1 shows 50 bp ladder; lanes (2, 3, 4, 5, 6, 7, 8, 9, 10, and 11) show the amplification product of HFE gene at 387 bp. (2) Digestion products of HFE gene by RsaI at 247 and 140 bp. Lane 1 shows 50 bp ladder; lanes (2, 3, 4, 5, 6, 7, 8, 9, and 10) show GG homozygote (normal alleles) at (247–140) bp, lane 11 shows 100 bp ladder. (3) Amplification product of HFE gene at 208 bp. Lane (1) shows 100 bp ladder; lanes (2, 3, 4, 5, 6, 7, 8, 9, and 10) show the amplification product of HFE gene at 208 bp; lane (11) shows 50 bp ladder. (4) Digestion products of HFE gene by BclI at 70, 138, and 208 bp. Lane 1 shows 50 bp ladder; lanes (2, 6, 8, and 10) show CC homozygote at (70–138) bp, lanes (3, 4, 5, and 7) show GG homozygote at (208) bp and lanes (9 and 11) show CG heterozygote at (70–138 and 208) bp.
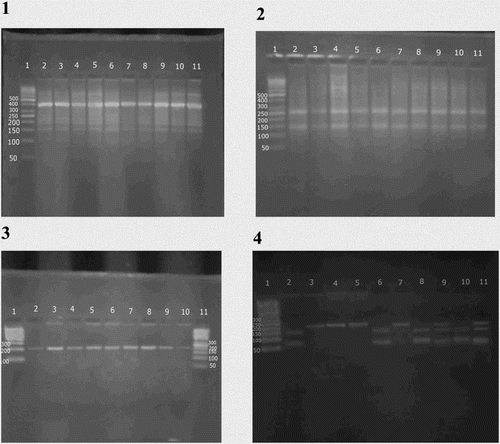
Figure 1. Agarose gel electrophoresis of (1) amplification product of HFE gene at 387 bp. Lane 1 shows 50 bp ladder; lanes (2, 3, 4, 5, 6, 7, 8, 9, 10, and 11) show the amplification product of HFE gene at 387 bp. (2) Digestion products of HFE gene by RsaI at 247 and 140 bp. Lane 1 shows 50 bp ladder; lanes (2, 3, 4, 5, 6, 7, 8, 9, and 10) show GG homozygote (normal alleles) at (247–140) bp, lane 11 shows 100 bp ladder. (3) Amplification product of HFE gene at 208 bp. Lane (1) shows 100 bp ladder; lanes (2, 3, 4, 5, 6, 7, 8, 9, and 10) show the amplification product of HFE gene at 208 bp; lane (11) shows 50 bp ladder. (4) Digestion products of HFE gene by BclI at 70, 138, and 208 bp. Lane 1 shows 50 bp ladder; lanes (2, 6, 8, and 10) show CC homozygote at (70–138) bp, lanes (3, 4, 5, and 7) show GG homozygote at (208) bp and lanes (9 and 11) show CG heterozygote at (70–138 and 208) bp.

Table 1. Demographic data of the studied groups.

Table 2. Anthropometric measures of the studied groups.

Table 3. Iron profile of the studied groups.

Table 4. Genotype frequencies and allelic distribution of C282Y and H63D mutations among studied groups.

Table 5. Iron profile with different H63D genotypes in studied groups.

Table 6. H63D genotype frequency among male and female ALL survivors.

Table 7. Iron profile among male and female ALL survivors.

Reprints and Corporate Permissions

Please note: Selecting permissions does not provide access to the full text of the article, please see our help page How do I view content?

To request a reprint or corporate permissions for this article, please click on the relevant link below:

Academic Permissions

Please note: Selecting permissions does not provide access to the full text of the article, please see our help page How do I view content?

Obtain permissions instantly via Rightslink by clicking on the button below:

If you are unable to obtain permissions via Rightslink, please complete and submit this Permissions form. For more information, please visit our Permissions help page.