Figures & data
Figure 1. (A) Using PCA with the Partek Genomics Suite software showed good segregation of normal (N1–N4), chemotherapy-responsive/-sensitive (NR1–NR5), and chemotherapy-resistant (R1–R5) samples. (B) Hierarchical clustering identified 12 significantly differently methylated genes in the chemoresistant group. Majority were methylated higher in this group. Acute lymphoblastic leukemia samples (NR and R) were tested in duplicates. (C) Dot plots of the most differentially methylated genes, CDH11 and ADAMTSL5, showing beta-values for individual samples (N1–N4, NR1–NR5, and R1–R5) and also median beta-values for the three groups, chemoresponsive (sensitive), chemoresistant (resistant) acute lymphoblastic leukemia, and normal samples.
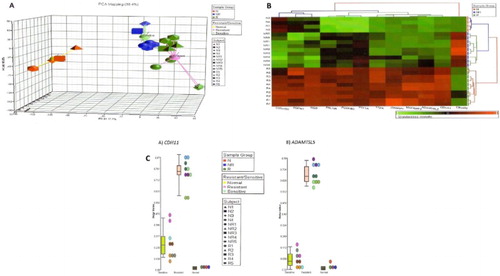
Table 1. Clinical characteristics of pre-B-ALL achieving CR and Res.
Figure 2. Representative gel electrophoresis of amplicons from PCR using methylated (M) and unmethylated (U) primers specific to (A) ADAMTSL5, (B) CDH11, and (C) ZNF214 on normal controls (n = 6), chemoresistant (n = 5), and chemoresponsive/-sensitive (n = 5) pre-B-ALL. These are the samples used in the microarray experiment. Each sample amplified by methylated and unmethylated primers is separated by dotted lines.
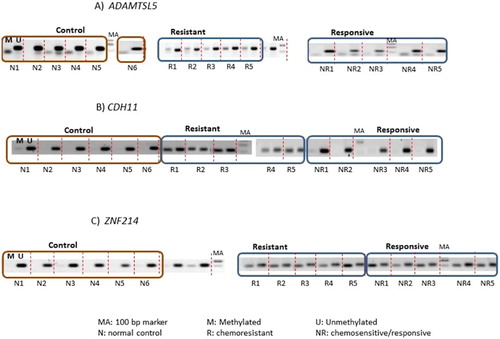
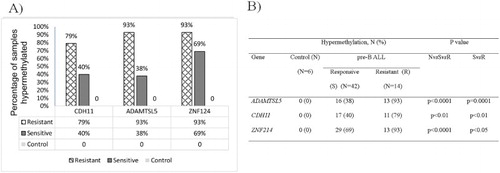
Figure 3. (A) Frequency and (B) significance in DNA hypermethylation of CDH11, ADAMTSL5, and ZNF214 in chemoresistant, chemosensitive pre-B-ALL, and normal controls. One-way ANOVA was used to test for NvsSvsR. Unpaired t-test was used for SvsR.