Figures & data
Table 1. Primer sequences used for real-time PCR.
Figure 1. Platelet counts in mice at different times after the injection of MWReg30 monoclonal antibody. BALB/c mice were injected with 1.4 µg MWReg30 antibody on Days 1 and 2, 2.1 μg on Day 3, and 2.8 μg from Day 4 to Day 8. The control group was injected with the same volume of IgG1. The PLT count was reduced to half the initial value by 24 h and the PLT count was constant from Day 3 to Day 8 in the ITP mouse model (n = 10 mice/group).
Figure 2. Cytokine analysis in ITP and control groups. Whole blood was obtained by enucleation on Day 8. Plasma samples were collected to assess the concentration of serum cytokines by ELISA. Data are shown as the means ± s.d. *P < 0.05. **P < 0.01. vs. normal controls.
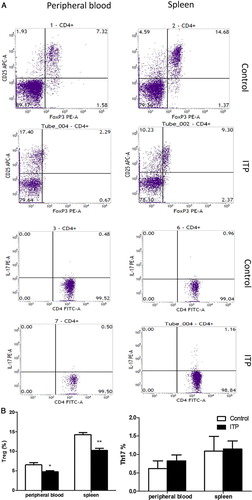
Figure 3. CD4+CD25+Foxp3+ Treg and Th17 cells in peripheral blood and spleen of ITP and control groups. (a) Flow cytometric analysis of Treg and Th17 cells. The lymphocytes were first selected based on their side and forward scatters. The CD25+Foxp3+ double-positive cells were defined in the CD4 gate and considered the Treg population. The CD4+IL17+ positive cells were defined as Th17 populations; (b) Box plots represent the percentage of Treg and Th17 cells in ITP mice and controls. *P < 0.05. **P < 0.01. vs. normal controls.