Figures & data
Figure 1. Flowchart of study screening and selection process.
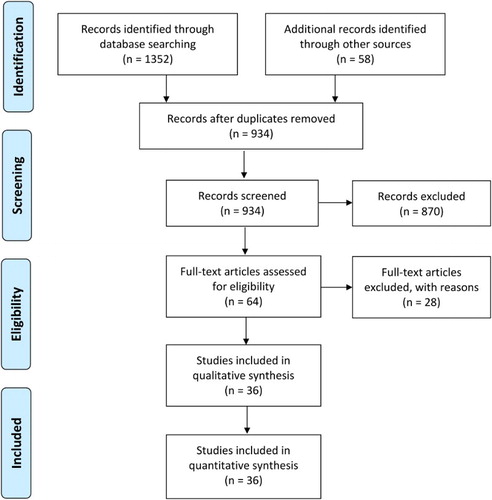
Figure 2. A funnel plot showing outcomes of funnel plot symmetry test. Circles inside squares represent possible missing studies as identified by trim and fill method.
Table 1. Important characteristics of the included studies.
Figure 3. Forest graph showing the overall effect size and subgroup-wise effect sizes of complete remission rate following various combined therapies for induction. Abbreviations: ATRA, all-trans retinoic acid; AraC, cytarabine; ATO, arsenic trioxide; BHAC, behenoyl cytosine arabinoside; DNR, daunorubicin; and IDA, idarubicin.
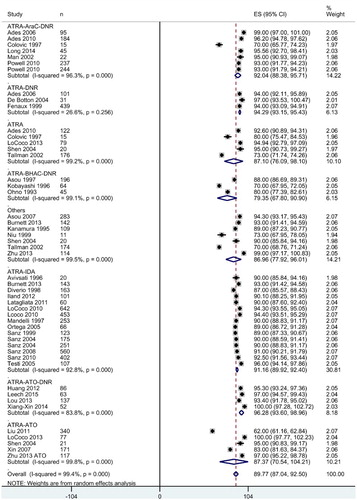
Figure 4. Forest graph showing the overall effect size and subgroup-wise effect sizes of relapse rate following various combined therapies for induction. Abbreviations: ATRA, all-trans retinoic acid; AraC, cytarabine; ATO, arsenic trioxide; BHAC, behenoyl cytosine arabinoside; DNR, daunorubicin; and IDA, idarubicin.
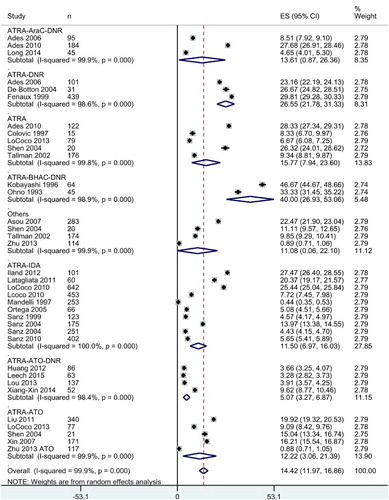
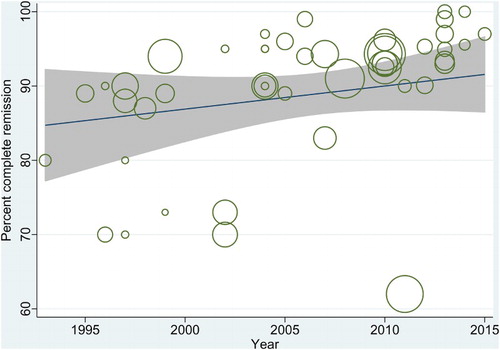
Figure 5. A scatterplot showing the relationship between year of publication (from 1990 to 2015) and CR rate.