Figures & data
Table 1. Characteristics of subjects according to deficiency, insufficiency, and sufficiency of vitamin D.a
Figure 1. Platelet count according to vitamin D groups. P-values were calculated by ANOVA: platelet count was 261.5±51.2×10³/μL in 25(OH)D deficiency, 249.8±47.6×10³/μL in 25(OH)D insufficiency, 246.9±47.4× 10³/μL in 25(OH)D sufficiency.
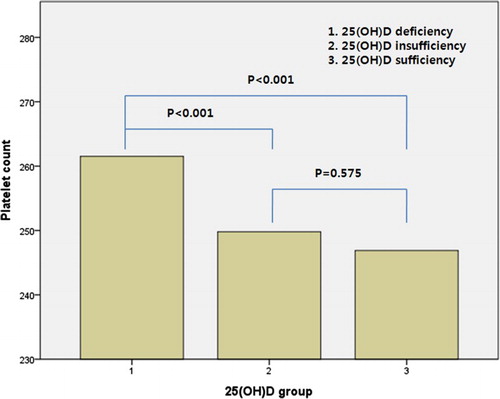
Figure 2. Mean platelet volume according to vitamin D groups. P-values were calculated by ANOVA: mean platelet volume was 8.5±0.8fL in 25(OH)D deficiency, 8.4±0.8fL in 25(OH)D insufficiency, 8.3±0.8fL in 25(OH)D sufficiency.
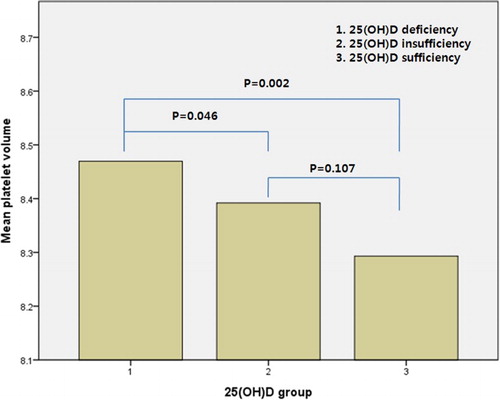
Figure 3. The expected inverse relationship between platelet count and mean platelet volume. P-value was calculated by Pearson’s correlation.