Figures & data
Table 1. Definition of the types and description of the morphological features for dysplasias in erythroid, megakaryocytic and granulocytic lineages.
Figure 1. Comparison of PSDCs in patients with MDS and non-clonal anemia. Blue strips represent for MDS and red strips represent for non-cloned disorders. *P < 0.05, compared with that of non-clonal anemia.
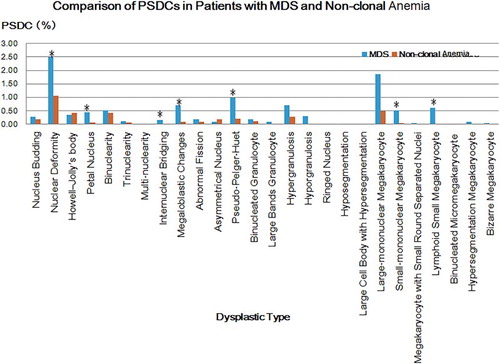
Figure 2. ROC curve of the PSDC in six specific dysplastic types.
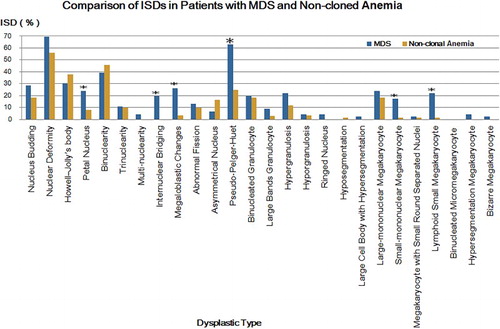
Table 2. Diagnostic efficacies of four specific dysplastic types for MDS.
Figure 3. Comparison of diagnostic efficacies of dysplasia in three hematopoietic cell lineages in patient with MDS and non-clonal anemia. Blue strips represent for erythroid lineage, red strips represent for granulocytic lineage, and green strips represent for megakaryocytic lineage.
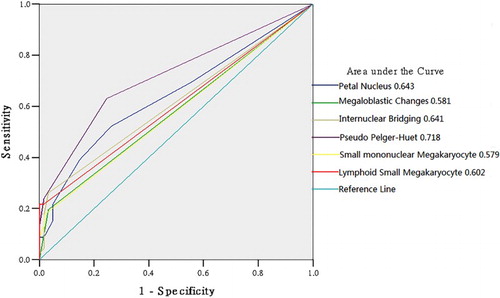
Table 3. Case number and percentage of lineage dysplastic rate ≧10% in patients with MDS and non-clonal anemia
Table 4. Laboratory features of 92 MDS patients.
Table 5. Diagnostic efficacy of three lineage dysplastic rates for MDS
Figure 4. Comparison of ISDs in patients with MDS and non-clonal anemia. Blue strips represent for MDS and orange strips represent for non-cloned disorders. *P < 0.05, compared with that of non-clonal anemia.
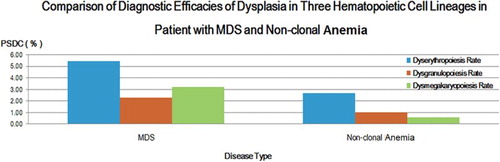
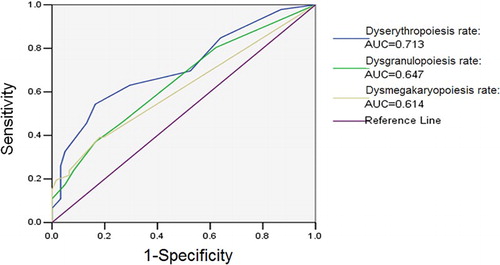
Figure 5. ROC curve of three lineage dysplastic rates in MDS. In MDS patients, the AUCs of dysgranulopoiesis rate, dyserythropoiesis rate and dysmegakaryopoiesis rate were all greater than 0.6 (P < 0.05), of which dyserythropoiesis rate was the largest one.