Figures & data
Figure 1. Human Hb S/C LAMP test procedure. RT, room temperature.
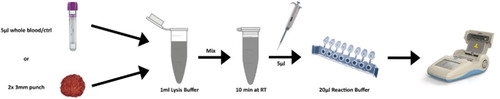
Table 1. Interpretation criteria for the Hb S/C kit.
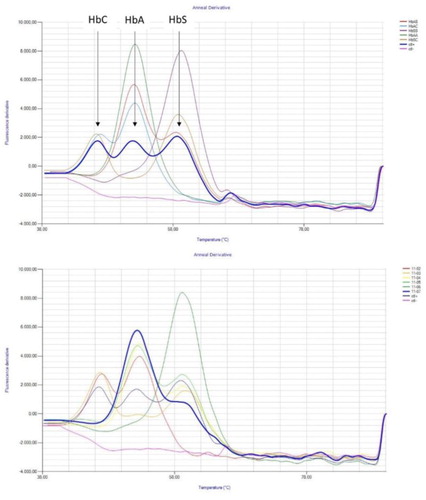
Figure 2. Result obtained with the Human Hb S/C LAMP method. (a) Graphical presentation of a result. The HbC, HbA and HbS peak are indicated on the graph. The melting curve for the positive plasmid control (ctl+), with three peaks, is presented in bold blue. The negative control (ctl−) is presented in pink. (b) Graphical presentation of the doubtful HbAS sample, indicated in bold blue. A small HbS peak is visible but is not detected by the software due to the limited peak deepness.