Figures & data
Figure 1. Schematic representation of the altitude in each group.
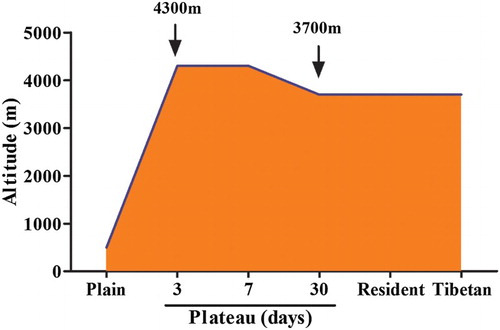
Table 1. The baseline characteristics of each group.
Figure 2. RBCs count and HGB concentration in different population. Whole blood was collected from the volunteers before and after entering the plateau, as well as Tibetan and Han population who lived in plateau for at least 10 years. RBCs count (A, C) and HGB concentration (B, D) were detected within 8 hours after blood collection. *P < 0.05, **P < 0.01 or ***P < 0.001 for subjects versus plain group.
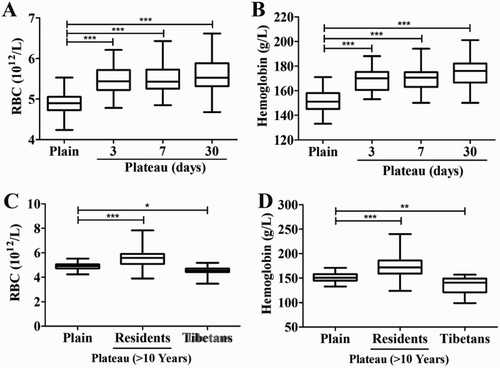
Figure 3. P50 value changes in different populations. The P50 was detected in Han population (A) or in Tibetan (B) using a blood oxygen analyzer.
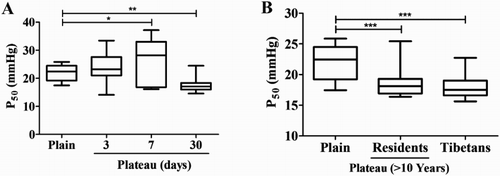
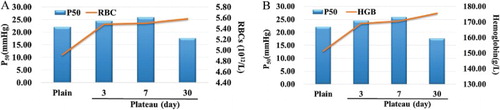
Figure 4. Linear relationship between P50 value and RBC, HGB in plain population. The RBCs count (A) and HGB concentration (B) versus P50 values during Han population rapidly entering plateau.