Figures & data
Table 1. Primers used in qRT-PCR.
Figure 1. ATP measurements of all cell lines upon drug treatments. Cell viability was assessed with an ATP-based assay. Cells were treated with (a) Ara-C, (b) 5-azacytidine (Videza), (c) 5-aza-2-deoxycytidine (Decitabine) and (d) CAPE at various concentrations for 3 days. Data are presented as mean ± SD.
Figure 2. Cell viability (%) of drug-resistant cell lines treated together with CAPE and the conventional therapeutics. (a) Ara-C-resistant HL-60, K562, and NB-4 cell lines treated with Ara-C, CAPE, and Ara-C and CAPE in combination, (b) Videza- and Decitabine-resistant K562 cell line treated with CAPE in combination for 4 days. Data are presented as mean ± SD. ***p < 0.001, **p < 0.01, *p < 0.05.
Figure 3. Flow cytometric analysis of CD243 and Rhodamine efflux assay in NB-4 and K562 cell lines. (a), (b), (d) and (e) are representative histograms. (c) % presentation of the CD243 expression and (d) rhodamine in K562 and NB-4 cell lines. Data are presented as mean ± SD.
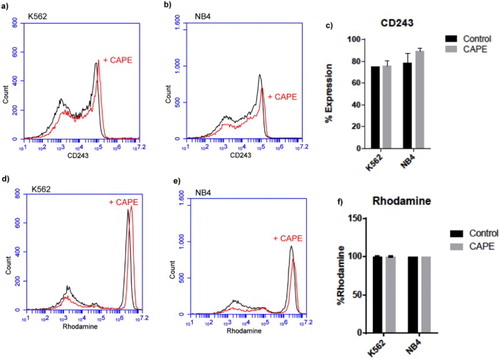
Figure 4. Oxygen consumption assay. Oxygen consumption rates (OCR) of all cell lines upon CAPE treatment. Data are presented as mean ± SD. *p < 0.05.
Figure 5. qRT-PCR analysis of glycolytic enzymes. Changes in the mRNA expression of key glycolytic enzymes upon CAPE treatment were relatively calculated against untreated samples. ***p < 0.001, **p < 0.01, *p < 0.05.
Figure 6. qRT-PCR analyses of STAT3 expression. STAT3 mRNA levels were determined upon CAPE treatment. **p < 0.01, *p < 0.05.