Figures & data
Figure 1. Shows the expression of CD200 and CD56 in adult B-ALL case. The patient is positive for CD200 but negative for CD56.
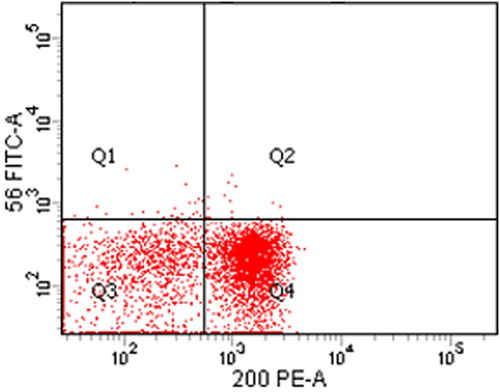
Table 1. Hematological and clinical data in CD200+ B-ALL patients vs. CD200− B-ALL patients.
Table 2. Hematological and bio-chemical data in CD56+ B-ALL vs. CD56− ALL patients.
Table 3. Cox regression analysis for prediction of OS in adult B-ALL cases.
Table 4. Cox regression analysis for prediction of DFS in adult B-ALL cases.
Figure 2. OS in CD200+ vs. CD200− B-ALL patients; the OS is shorter in CD200+ group as compared to CD200− one (p = 0.042).
Figure 3. DFS in CD200+ vs. CD200− B-ALL patients; the DFS is shorter in CD200+ group as compared to CD200− one (p = 0.006).
Figure 4. OS in CD56+ vs. CD56− B-ALL patients; the OS is shorter in CD56+ group as compared to CD56− one (p = 0.003).
Figure 5. DFS in CD56+ vs. CD56− B-ALL patients; the DFS is shorter in CD56+ group as compared to CD56− one (p = 0.007).