Figures & data
Table 1. Baseline characteristics of patients with ITP and controls.
Table 2. Proportion of cell subsets in new diagnosed ITP, relapsed ITP and healthy controls.
Table 3. Cell subsets in ‘effective’ and ‘ineffective’ group before treatment.
Figure 1. CD4/CD8 ratio, CD4+Treg cells, NK cells and B cells in ‘effective’ and ‘ineffective’ group after treatment. (A) CD4/CD8 ratio in ‘ineffective’ group, ‘effective’ group, healthy controls were 2.23 ± 1.10, 1.39 ± 0.80 and 1.25 ± 0.29, respectively. (B) The proportion of CD4+Treg cells (within CD4+ T cell gate) in ‘ineffective’ group, ‘effective’ group, healthy controls were 5.16 ± 1.92, 7.26 ± 2.23 and 5.21 ± 1.17, respectively. (C) The proportion of NK cells (within lymphocyte gate) in ‘ineffective’ group, ‘effective’ group, healthy controls were 6.36 ± 4.54, 7.05 ± 5.42 and 14.15 ± 5.42, respectively. (D) The proportion of B cells (within lymphocyte gate) in ‘ineffective’ group, ‘effective’ group, healthy controls were 3.77 ± 2.75, 5.08 ± 3.16 and 4.40 ± 1.94, respectively.
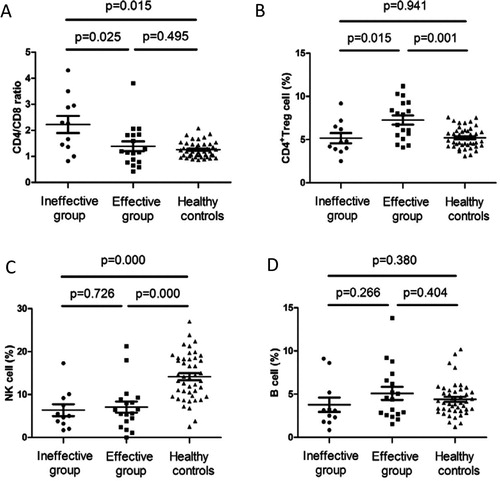
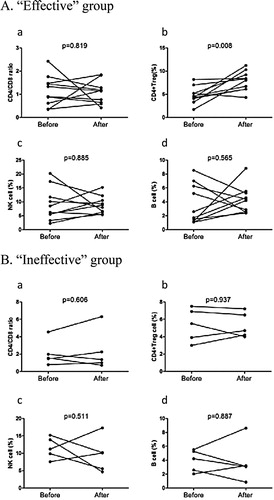
Figure 2. Pre- and post-treatment immune state in ‘effective’ and ‘ineffective’ group. (A) CD4/CD8 ratio, proportion of CD4+Treg cell, NK cell and B cell in ‘effective’ group (n=10). (B) CD4/CD8 ratio, proportion of CD4+Treg cell, NK cell and B cell in ‘ineffective’ group (n=5).