Figures & data
Table 1. Comparison of general information between DVT group and control group.
Figure 1. MTHFR genotype analysis electrophoresis map. 1–2: CC genotype; 3–4: CT genotype; 5–10: TT genotype; M: DNA Marker DL2000.
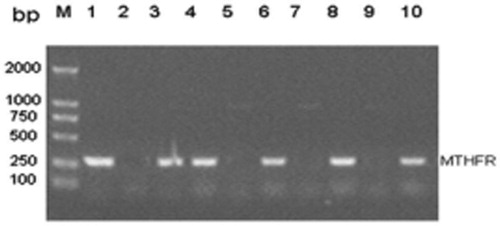
Table 2. C/T frequency distribution of 677th loci in MTHFR between two groups of people.
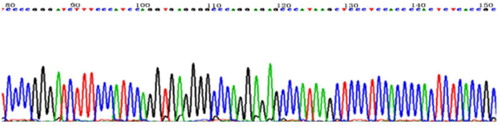
Figure 2. Partial sequencing of C/T mutation at 677th locus of MTHFR. 2.4 Hardy–Weinberg test of genotype distribution in two groups.