Figures & data
Figure 1. Effects of PACAP deficiency after chronic daily restraint stress for 1, 2, or 3 h per week. (A) Schematic representation of experimental design and timeline for 7-d chronic stress. Animals were single-housed for over a week and habituated to handling for 3 d prior to restraint stress. Chronic restraint stress (CRS) was administered for either 1-, 2-, or 3-h duration daily over seven consecutive days. Control cohort of animals was subjected to identical conditions except that they remained undisturbed in their home cages in the test room during the daily CRS period. Tail blood was systemically collected on days 0 and 7 for CORT assay. Body weight and food were measured on day 0 (pre-stress) and day 7 (post-stress). (B) Body weight loss during 7-d chronic restraint in wild-type and PACAP-deficient mice. Chronic restraint stress daily for either 1-, 2-, or 3 h, led to significant weight loss in wild-type restrained mice when measured on day 7 post-stress, but not in PACAP-deficient mice. Results are expressed as mean ± SEM (n = 8–15 for each group). Initial body weights for wild-type mice 24.75 ± 0.42 g (mean ± SEM, n = 41); for PACAP-deficient mice 24.71 ± 0.21 g (mean ± SEM, n = 42). Two-way ANOVA followed by Bonferroni’s post hoc test, *p < 0.05, **p < 0.01, ***p < 0.001. (C). Lack of weight loss after chronic restraint in PACAP−/− mice is due to reversal of decreased food intake. Measurement of food intake in PACAP+/+ mice subjected to stress demonstrated that weight loss was a direct consequence of hypophagia, and this stress-related decrease in food intake was not observed in PACAP−/− mice. Results are expressed as mean ± SEM (n = 8–19 per group). Two-way ANOVA followed by Bonferroni’s post hoc test, **p < 0.01; ***p < 0.001; ns, not significant. (D) CORT elevation during 7-d chronic restraint stress (CRS) in wild-type and PACAP-deficient mice. CORT was significantly elevated across 7 d for wild-type group upon CRS 1–3 h daily. PACAP deficit significantly reduced this elevation when restraint stress was applied 2 h or 3 h daily, but not 1 h daily. Results are expressed as mean ± SEM (n = 8–15 per group). Repeated measures two-way ANOVA followed by post hoc Bonferroni test, ***p < 0.001; ns: not significant.
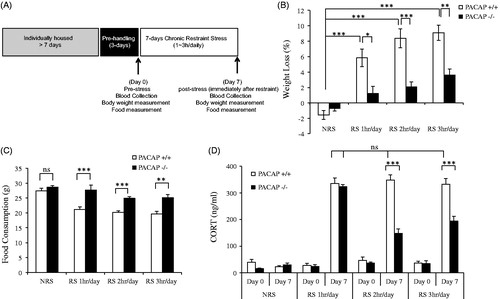
Figure 2. Peak CORT elevation and decay across 1-h chronic daily restraint stress for one week. (A) Schematic representation of experimental design and timeline for 7-d chronic stress, with two times of blood collection on day 1 and day 7. Animals were single-housed for over a week and habituated to handling for 3 d prior to restraint stress. Chronic restraint stress (CRS) was administered for 1-h duration daily over seven consecutive days. Control cohort of animals was subjected to identical conditions except that they remained undisturbed in their home cages in the test room during the daily CRS period. Tail blood was collected twice (immediately and 5 h after restraint) on days 0, 1, and 7 for CORT assay. Body weight and food were measured on day 0 (pre-stress) and day 7 (post-stress). (B). CORT elevation on day 1 and day 7 during 7-d restraint stress in wild-type and PACAP-deficient mice. CORT was significantly elevated on days 1 and 7 for both wild-type and PACAP-deficient group immediately after 1-h restraint. CORT level dropped to a similar level to unstressed animals (NRS) when blood was collected 5 h later. Results are expressed as mean ± SEM (n = 5 for each group). Repeated measures two-way ANOVA followed by post hoc Bonferroni test, **p < 0.01, ***p < 0.001; ns, not significant. (C) Weight loss (upper panel) and food consumption (lower panel) during 7-d restraint-effect of PACAP deficiency. Chronic restraint stress daily for 1 h, led to significant weight loss and decreased food consumption in wild-type restrained mice when measured on day 7 post-stress, but not in PACAP-deficient mice. Results are expressed as mean ± SEM (n = 5 for each group). Two-way ANOVA followed by Bonferroni’s post hoc test, **p < 0.01, ***p < 0.001; ns: not significant. Initial body weights for wild-type mice 26.57 ± 0.41 g (mean ± SEM, n = 10); for PACAP-deficient mice 24.95 ± 0.43 g (mean ± SEM, n = 10).
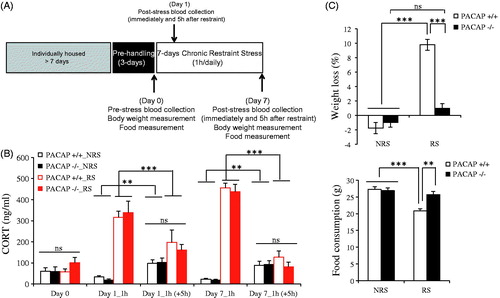
Figure 3. Effects of PACAP deficiency on weight loss and total CORT elevation following a single administration of restraint stress for 1, 2, or 3 h. (A) Schematic representation of experimental design and timeline for acute or one time prolonged restraint stress. Animals were single-housed for over a week and habituated to handling for 3 d prior to restraint stress. Restraint stress (ARS) was administered for 1 ∼ 3-h duration. Control cohort of animals was subjected to identical conditions except that they remained undisturbed in their home cages in the test room during the restraint session. Tail blood was collected immediately after 1–3-h restraint, or 1 ∼ 2 h after 1-h restraint) for CORT assay. Body weight was measured on day 1 (pre-stress) and day 2 (post-stress). (B) Effect of PACAP deficiency on CORT elevation after one time 1 ∼ 3-h restraint stress. CORT was significantly elevated after 1 ∼ 3-h restraint stress in wild-type mice. PACAP deficiency significantly reduced this elevation only after 3-h restraint. Results are expressed as mean ± SEM (n = 4–17 per group). Two-way ANOVA followed by Bonferroni’s post hoc test, ***p < 0.001; ns, not significant. (C) Effect of PACAP deficiency on weight loss after single (1–3 h) restraint stress. Body weight was significantly decreased after 1–3 h restraint stress in wild-type mice, but not in PACAP-deficient mice. Results are expressed as mean ± SEM (n = 4–10 per group). Two-way ANOVA followed by Bonferroni’s post hoc test, *p < 0.05, ***p < 0.001; ns, not significant. Initial body weights for wild-type mice 25.26 ± 0.49 g (mean ± SEM, n = 24); for PACAP-deficient mice 24.83 ± 0.37 g (mean ± SEM, n = 25).
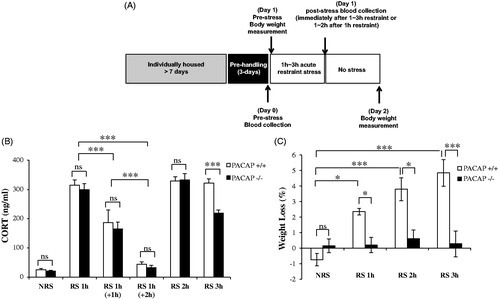
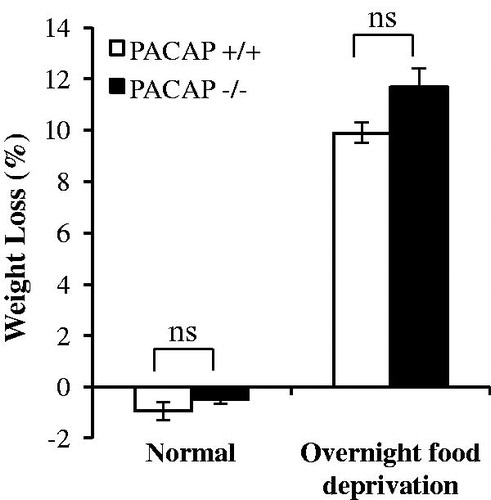
Figure 4. Weight loss after 24-h food deprivation. Animals were housed in normal cages supplied with food or from which food was removed for a 24-h period. There is no significant difference in weight loss due to fasting, between wild-type mice and PACAP-deficient mice. Results are expressed as mean ± SEM (n = 4–10 per group). Two-way ANOVA followed by Bonferroni’s post hoc test, ns, not significant. Initial body weights for wild-type mice 24.13 ± 0.91 g (mean ± SEM, n = 14); for PACAP-deficient mice 24.61 ± 0.43 (mean ± SEM, n = 13).