Figures & data
Figure 1. Main AVP synthesizing areas in the brain. Schematic diagram of a rat brain showing brain areas with cell populations synthesizing the nonapeptide arginine vasopressin (AVP). (A) The main axonal projections from the AVP magnocellular neurons in the SON and PVN are to the posterior pituitary gland (not shown). Intranuclearly released AVP may reach remote brain areas (e.g. LS or MeA). (B) The five main nuclei synthesizing AVP. Pink areas represent magnocellular cell groups. BNST: bed nucleus of the stria terminalis; LS: lateral septum; MeA: medial amygdala; PVN: paraventricular nucleus of the hypothalamus; SCN: suprachiasmatic nucleus; SON: supraoptic nucleus.
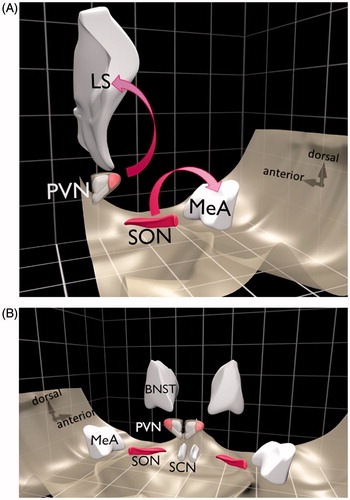
Table 1. Summary of the data obtained in defined behavioral tests with different sex/reproductive states for vasopressin (AVP)-deficient Brattleboro rats (di/di) under different treatment conditions.
Figure 2. Vasopressin (AVP) microdialysis into the PVN and behavior tests. Mimicking intracerebral release of vasopressin (AVP) by retrodialysis of AVP into the paraventricular nucleus of the hypothalamus (PVN) in AVP-deficient Brattleboro rats (di/di, n = 10). Selected behavioral parameters were measured in the defensive withdrawal (A–C) and elevated plus maze (D–F) tests. Data are means ± SEM. +/+: non-AVP-deficient controls (n = 10); di/di AVP: AVP-deficient (Brattleboro) rats receiving AVP retrodialysis (n = 13). Statistical analysis was conducted using the nonparametric module of the StatSoft 12.0 program (Tulsa, OK) with Mann–Whitney pair-wise comparisons. *p < 0.05 vs +/+; (*): p = 0.08 vs +/+.
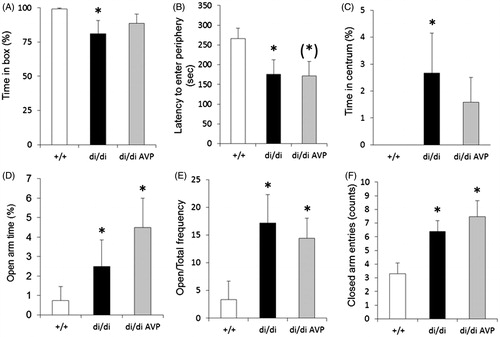
Figure 3. Vasopressin (AVP) microdialysis into the septum and behavior tests. Effects of AVP retrodialysis into the septum of AVP-deficient Brattleboro rats (di/di, n = 11) on selected behavioral parameters measured in the defensive withdrawal (A–C), elevated plus maze (D–F) and forced swim (G–I) tests. Data are means ± SEM. +/+: non-AVP-deficient controls (n = 10); di/di AVP: AVP-deficient (Brattleboro) rats receiving AVP retrodialysis (n = 11). Statistical analysis was conducted using the nonparametric module of the StatSoft 12.0 program with Mann–Whitney pair-wise comparisons. **p < 0.01 vs +/+; (*): p = 0.065 vs +/+; (#): p = 0.056 vs di/di.
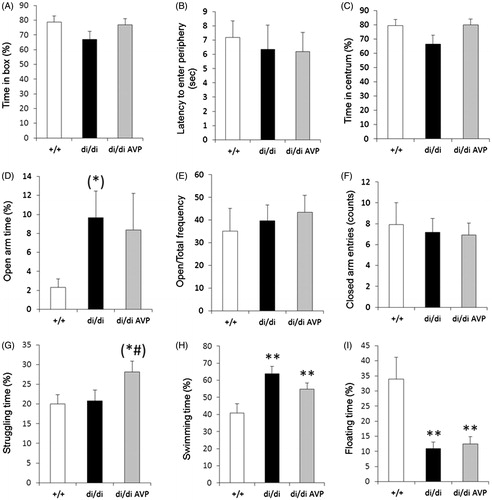
Figure 4. Body weight (A) and water consumption (B) after injection into the PVN of adeno-associated virus (AAV) containing the intact AVP nucleotide sequence (vAVP). Time-course of changes in body weight (A) and water consumption (B) in vasopressin (AVP)-deficient (di/di) Brattleboro rats after bilateral injection of adeno-associated virus (AAV) containing AVP-nucleotide into the paraventricular nucleus of the hypothalamus (PVN): di/di vAVP group; controls were either di/di rats given AAV containing galactosidase nucleotide sequence, or untreated +/+ non-AVP-deficient controls; n = 10 per group. Data are means ± SEM. Statistical analysis was conducted using the repeated measure ANOVA module of the StatSoft 12.0 program with Newman–Keuls post hoc comparisons. (A) *p < 0.05; **p < 0.01 vs +/+; (B) the main effects of group, time as well as their interaction were statistically significant (p < 0.01); for clarity (B) does not contain statistical symbols, the main effects of group, time as well as their interaction were significant (p < 0.01).
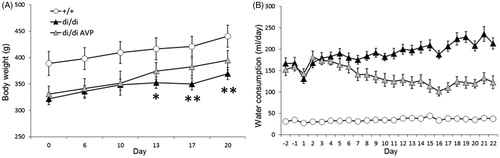
Figure 5. Behavior tests after rescue of vasopressin (AVP) synthesis by bilateral injection of adeno-associated virus (AAV) containing the intact AVP nucleotide sequence (vAVP) into the PVN of AVP-deficient Brattleboro rats (di/di) rats. Data are shown for selected parameters measured in the tests for: defensive withdrawal (A–C, n = 4–5 per group), elevated plus maze exposure (D–F, n = 9 per group) and forced swimming (G–I, n = 9 per group). Data are means ± SEM. +/+: AVP-non-deficient controls; di/di vAVP: AVP-deficient rats with adeno-associated virus vector treatment (). Statistical analysis was conducted using the nonparametric module of the StatSoft 12.0 program with Mann–Whitney pair-wise comparisons. *p < 0.05 vs +/+; (*): p = 0.06 vs +/+; (#): p = 0.06 vs di/di.
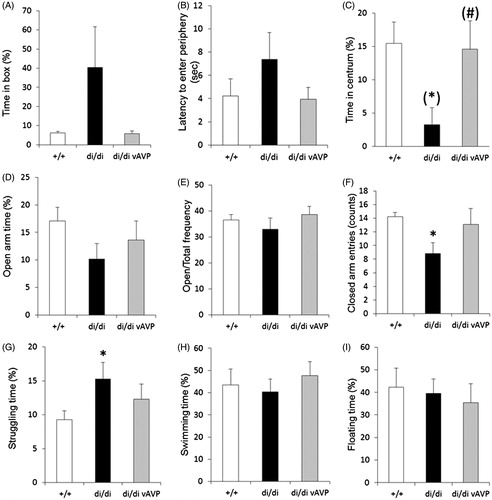
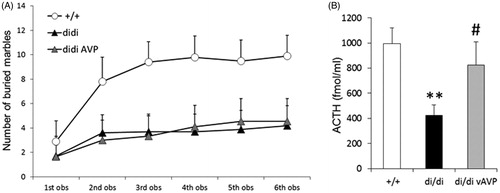
Figure 6. Marble burying (MB) test behavior (A) and ACTH secretory response to an acute stressor (B) after bilateral injection of adeno-associated virus (AAV) containing the intact AVP nucleotide sequence (vAVP) into the PVN of AVP-deficient Brattleboro rats (di/di) rats. (A) Selected parameters measured in the marble burying test (MB, A, n = 9 rats per group); (B) adrenocorticotropin (ACTH) responses (n = 10 per group). In B rats were urethane anesthetized and challenged by an intraperitoneal injection of hypertonic saline; blood samples were collected after 15 min for ACTH RIA. Data are means ± SEM. +/+ =AVP-non-deficient controls; di/di vAVP = AVP-deficient rats receiving vAVP treatment (see ). Statistical analysis was conducted using the repeated measure (A) or one way (B) ANOVA module of the StatSoft 12.0 program with Newman Keuls post hoc comparisons. (A) The main effects of time and group × time interactions were statistically significant (p < 0.01); for clarity (A) does not contain statistical symbols; (B) **p < 0.01 vs +/+; #p < 0.05 vs di/di.