Figures & data
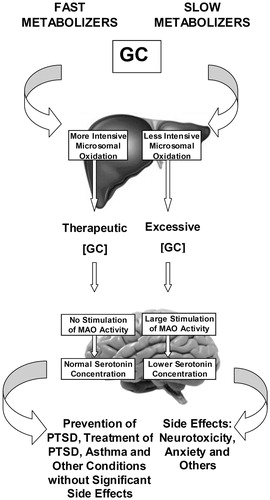
Figure 1. A frequency histogram showing distributions of the number of fast and slow metabolizing rats as a function of hexobarbital sleep duration. FM, fast metabolizers of triamcinolone acetonide; SM, slow metabolizers of triamcinolone acetonide. Abscissa, sleep duration, min; ordinate, number of rats.
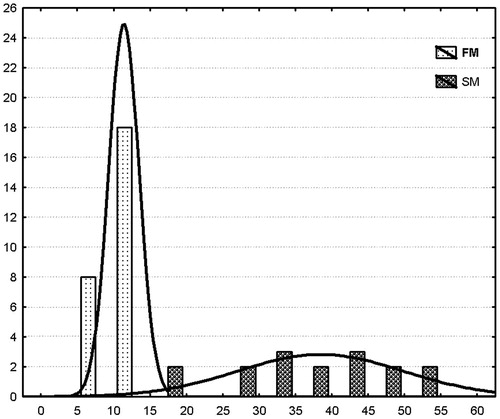
Table 1. Effect of triamcinolone acetonide (TA) on serotonin concentration and MAO-A activity in brain structures of fast and slow metabolizers of TA.
Figure 2. Regulation of MAO-dependent responses to glucocorticoids by intensity of hepatic microsomal oxidation in fast and slow metabolizers of triamcinolone acetonide. GC: glucocorticoid; MAO: monoamine oxidase; PTSD: posttraumatic stress disorder.