Figures & data
Table 1. Primers used in quantitative real time RT-PCR.
Figure 1. Effect of LPS on catecholamine biosynthetic pathway in adipocyte fraction of mesenteric adipose tissue of rats exposed to a single (1 × IMO) or repeated (7 × IMO) immobilization. C: control rats; Sal: saline injected; LPS: lipopolysaccharide injected. Dopamine (DA), norepinephrine (NE) and epinephrine (EPI) concentrations in adipocytes. Gene expression of catecholamine biosynthetic enzymes, tyrosine hydroxylase (TH) and phenylethanolamine N-methyltransferase (PNMT), as well as vesicular monoamine transporter (VMAT1) determined by real time RT-PCR. Values are normalized to internal control (18 S rRNA) and presented as fold change relative to control values evaluated by ΔΔCt method. Each column is displayed as mean ± S.E.M. and represents an average of 5–6 animals. Values of *p < 0.05, **p < 0.01, ***p < 0.001 defined the statistical significance versus control groups and values of +p < 0.05, ++p < 0.01, +++p < 0.001 LPS versus saline groups of the same stress interval.
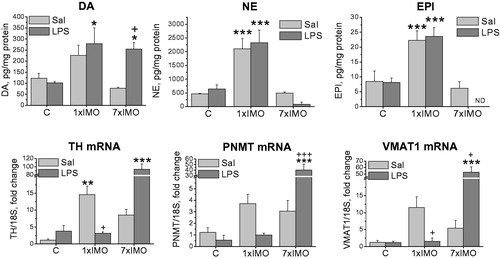
Figure 2. Expression of tyrosine hydroxylase (TH) and phenylethanolamine N-methyltransferase (PNMT) protein in adipocyte fractions, detected by Western blot. For TH, 30 μg and for PNMT 60 μg of soluble protein fraction was loaded into the gel lanes. Each column is displayed as mean ± S.E.M. and represents an average of 4–6 animals. Values of *p < 0.05, **p < 0.01, ***p < 0.001 defined the statistical significance versus control groups and values of +p < 0.05, ++p < 0.01, +++p < 0.001 LPS versus saline groups of the same stress interval.
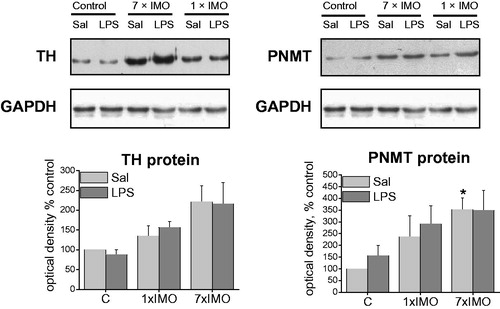
Figure 3. Levels of mRNAs encoding several immunological factors in adipocyte fractions. Interleukin 6 (IL-6), tumor necrosis factor (TNF-α), interleukin 10 (IL-10) and marker of differentiated macrophages (F4/80) in control rats (C) and in rats exposed to a single (1 × IMO) and repeated (7 × IMO) immobilization with subsequent injection of saline (Sal) or lipopolysaccharide (LPS). Each column is displayed as mean ± S.E.M. and represents an average of 5–6 animals. Values of *p < 0.05, **p < 0.01, ***p < 0.001 defined the statistical significance versus control groups and values of +p < 0.05, ++p < 0.01, +++p < 0.001 LPS versus saline groups of the same stress interval.
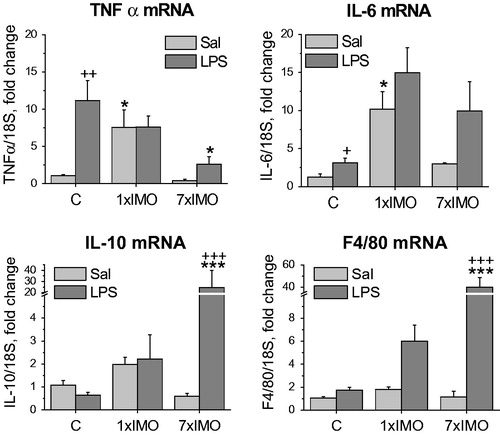
Figure 4. Correlation analysis between TH and F4/80 gene expressions.
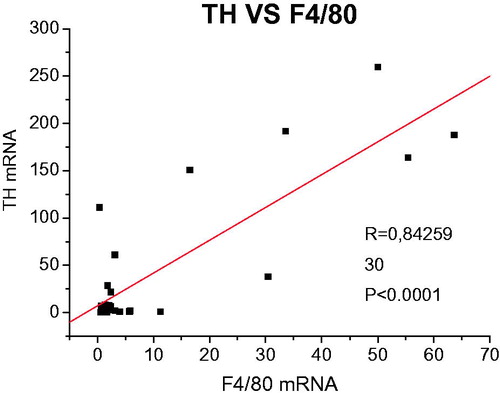
Table 2. Ex vivo effect of lipopolysaccharide (LPS).
Figure 5. Catecholamine biosynthetic pathway and inflammatory mediators in stromal/vascular fraction of mesenteric adipose tissue of rats exposed to a single (1 × IMO) or repeated (7 × IMO) immobilization. C: control rats; Sal: saline injected; LPS: lipopolysaccharide injected. Dopamine (DA), norepinephrine (NE) and epinephrine (EPI) concentrations. Gene expression of catecholamine biosynthetic enzymes, tyrosine hydroxylase (TH), phenylethanolamine N-methyltransferase (PNMT), vesicular monoamine transporter VMAT1, tumor necrosis factor (TNF-α), interleukin 10 (IL-10) and marker of differentiated macrophages (F4/80). Values are normalized to internal control (18 S rRNA) and presented as fold change relative to control values evaluated by ΔΔCt method. Each column is displayed as mean ± S.E.M. and represents an average of 5–6 animals. Values of *p < 0.05 defined the statistical significance versus control groups and values of +p < 0.05, LPS versus saline groups of the same stress interval.
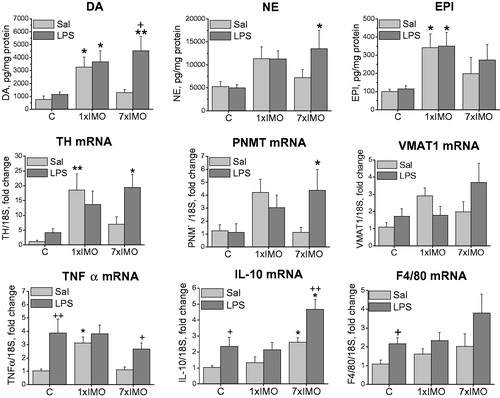
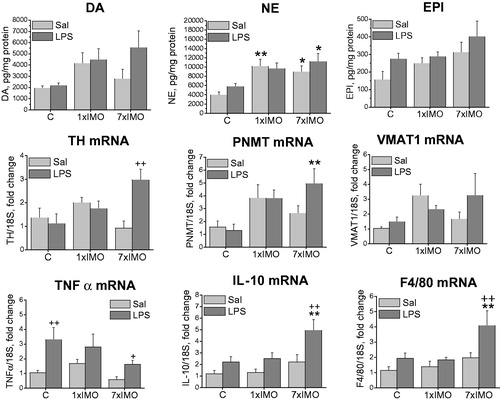
Figure 6. Catecholamine biosynthetic pathway and inflammatory mediators in entire mesenteric adipose tissue samples of rats exposed to a single (1 × IMO) or repeated (7 × IMO) immobilization. C: control rats; Sal: saline injected; LPS: lipopolysaccharide injected. Dopamine (DA), norepinephrine (NE) and epinephrine (EPI) concentrations. Gene expression of catecholamine biosynthetic enzymes, tyrosine hydroxylase (TH), phenylethanolamine N-methyltransferase (PNMT), vesicular monoamine transporter VMAT1, tumor necrosis factor (TNF-α), interleukin 10 (IL-10) and marker of differentiated macrophages (F4/80). Values are normalized to internal control (18 S rRNA) and presented as fold change relative to control values evaluated by ΔΔCt method. Each column is displayed as mean ± S.E.M. and represents an average of 5–6 animals. Values of *p < 0.05 defined the statistical significance versus control groups and values of +p < 0.05, LPS versus saline groups of the same stress interval.