Figures & data
Figure 1. Changes in salivary cortisol concentrations (A) and the heart rate (B) during the stress procedure in group of actors and non-actors. Statistical significance as revealed by ANOVA for repeated measures with subsequent Tukey post hoc test: XXX(p < 0.001) for both groups: for time points 45 min and 60 min versus 0 min and 30 min; ***(p < 0.001) for non-actors group: 30 min versus 0 min, 15 min and 45 min; #(p < 0.05) for time point non-actors versus actors. Inset, maximal increments of salivary cortisol concentrations (A) and the heart rate (B) in group of actors and non-actors. Statistical significance as revealed by t-test for independent group: **(p < 0.01). Data are expressed as means ± SEM.
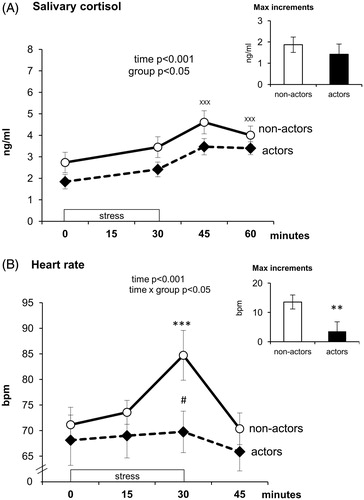
Figure 2. Changes in systolic (A) and diastolic (B) blood pressure during the stress procedure in group of actors and non-actors. Statistical significance as revealed by ANOVA for repeated measures with subsequent Tukey post hoc test: ***(p < 0.001) for both groups: for time points 15 min and/or 30 min versus 0 min and 45; Inset, maximal increments of systolic (A) and diastolic (B) blood pressure in group of actors and non-actors. Data are expressed as means ± SEM.
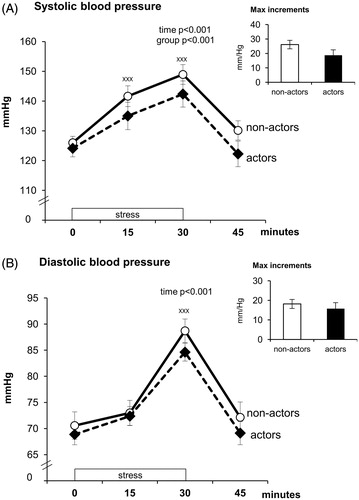
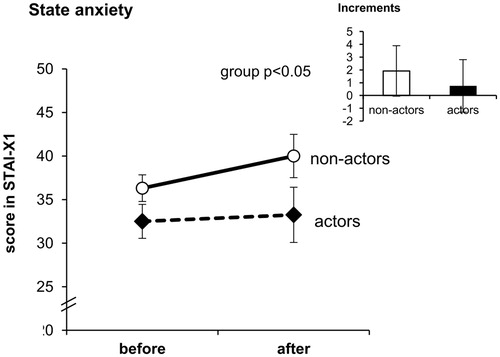
Figure 3. State anxiety level before and after the stress procedure in group of actors and non-actors. Statistical significance as revealed by ANOVA for repeated measures. Inset, increment in state anxiety score in group of actors and non-actors. Data are expressed as means ± SEM.