Figures & data
Figure 1. Effects of exposing mice, initially bred in a 12-h/12-h light/dark cycle (LDC), to either a 12 h/12 h (Regensburg) or 14 h/10 h (Ulm) LDC on plasma corticosterone (CORT) concentrations. Compared to single-housed (SH) mice housed in a 12-h/12-h LDC after arrival at Regensburg University (SHR = green bars), SH mice housed in a 14-h/10-h LDC after arrival at Ulm University (SHU = white bars) showed increased plasma CORT levels during the early (day 15/16; E) and middle (day 27/28; M) phases after arrival. Of note, SHU and SHR mice were all delivered from Charles River (Sulzfeld, Germany), where they were raised in a 12-h/12-h LDC. SHR (n = 4–8); SHU (n = 7–8). Data represent mean + SEM. *p < .05 versus respective SHR group.
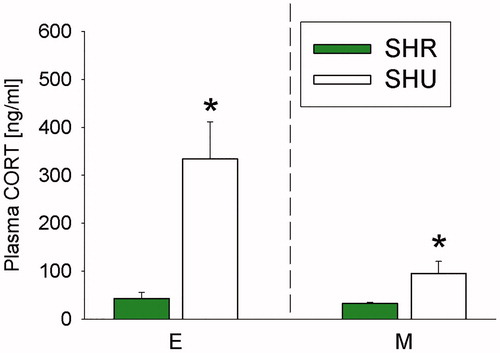
Figure 2. Effects of exposing mice, initially bred in a 12-h/12-h light/dark cycle (LDC), to a 14-h/10-h LDC at Ulm University on physiological parameters over time. Compared to the early phase after arrival (day 15/16; E), animals housed in a 14-h/10-h LDC after arrival at Ulm University showed (A) significantly decreased plasma corticosterone (CORT) levels during middle (day 27/28; M) and late (day 57/58; L) phase after arrival; (B) decreased plasma adrenocorticotropic hormone (ACTH) levels during middle (day 27/28; M) and late (day 57/58; L) phase after arrival; (C) decreased plasma CORT/ACTH ratio during late (day 57/58; L) phase after arrival; (D) a decreased basal (by trend; day 57/58; L) and ACTH (100 nM)-induced (day 27/28, M; day 57/58, L) in vitro adrenal CORT response. E (n = 7); M (n = 8), L (n = 8). Parametric data represent mean + SEM. Nonparametric data are presented as box-plot diagrams. Solid line represents the median, dashed line represents the mean for each data set. Lower box indicates 25th, upper box indicates 75th percentile. (*) p = .078 versus respective E group; *p< .05 versus respective E group; **p < .01 versus respective E group; ***p < .001 versus respective E group; #p < .05 versus respective basal group; ###p < .001 versus respective basal group.
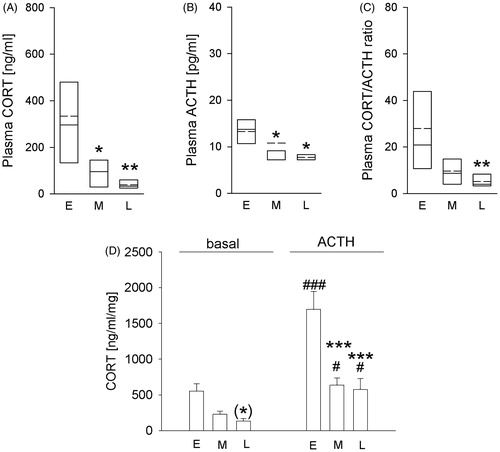
Figure 3. Effects of exposing mice, initially bred in a 12-h/12-h light/dark cycle (LDC), to a 14-h/10-h LDC at Ulm University on body and, relative and absolute adrenal weight over time. Compared to the early phase after arrival (day 15/16; E), animals housed in a 14-h/10-h LDC after arrival at Ulm University showed (A) increased body weight at the middle (day 27/28; M) and late (day 57/58; L) phase. Furthermore, at the late phase (L) animals showed increased body weight, compared to the middle (M) phase. (B) decreased relative adrenal weight at the middle (day 27/28; M) and late (day 57/58; L) phase. Furthermore, at the late-phase (L) animals showed decreased relative adrenal weight, compared to the middle (M) phase. (C) decreased absolute adrenal weight at the late (day 57/58; L) phase, compared to the early (day 15/16; E) phase and middle (day 27/28; M) phase after their arrival at Ulm. E (n = 7); M (n = 8), L (n = 8). Parametric data represent mean + SEM. Nonparametric data are presented as box-plot diagrams. Solid line represents the median, dashed line represents the mean for each data set. Lower box indicates 25th, upper box indicates 75th percentile. **p < .01 versus respective E group; ***p < .001 versus respective E group; ++p < .01 versus respective M group; +++p < .001 versus respective M group.
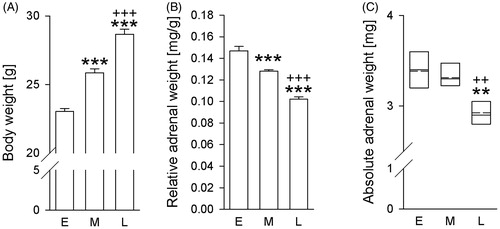
Figure 4. Effects of exposing mice, initially bred in a 12-h/12-h light/dark cycle (LDC), to either a 12-h/12-h (Regensburg) or 12-h/12-h (Ulm) LDC on plasma corticosterone (CORT) concentrations. Compared to single-housed (SH) mice housed in a 12-h/12-h LDC at Regensburg University (SHR; green bars), SH mice housed in a 12-h/12-h LDC at Ulm University (SHU; white bars) did not differ in plasma CORT concentration during the early (day 15/16; E) and middle (day 27/28; M) phase after delivery from Charles River (Sulzfeld, Germany; 12 h/12 h LDC). SHR (n = 4-8); SHU (n = 7–16). Nonparametric data are presented as box-plot diagrams. Solid line represents the median, dashed line represents the mean for each data set. Lower box indicates 25th, upper box indicates 75th percentile. If n > 8 per group, 10th (lower error bar), and 90th percentile (upper error bar) as well as possible outliers beyond the percentiles (indicated by closed circles) are shown.
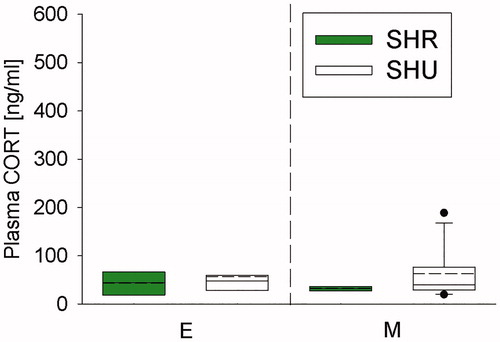
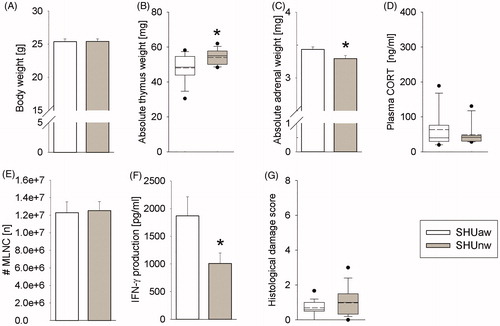
Figure 5. Effects of the drinking water quality on physiological and immunological parameters in single-housed mice at Ulm University (SHU). Compared to single-housed (SH) mice receiving acidified (pH∼2.4) water (SHUaw; white bars) for 27/28 days, SH mice receiving normal tap water (SHUnw; gray bars) for 27/28 days showed (A) comparable body weight at the time point of killing (day 27/28), (B) increased absolute thymus weight, (C) decreased absolute adrenal weight, (D) unaffected plasma corticosterone (CORT), (E) unaffected numbers (#) of viable mesenteric lymph node cells (MLNC), (F) decreased interferon-γ (IFN-γ) secretion from isolated and anti-CD3/CD28-stimulated MLNC in vitro and (G) an unaffected histological damage score of the colon. SHUaw (n = 16); SHUnw (n = 15). Parametric data represent mean + SEM. Nonparametric data are presented as box-plot diagrams. Solid line represents the median, dashed line represents the mean for each data set. Lower box indicates 25th, upper box indicates 75th percentile. If n > 8 per group, 10th (lower error bar), and 90th percentile (upper error bar) as well as possible outliers beyond the percentiles (indicated by closed circles) are shown. *p < .05 versus SHUaw group.