Figures & data
Table 1. Primer sequences and protocols used in PCR reactions. The initial denaturation was performed at 95 °C for 3 min. The final polymerization lasting 10 min was performed at 72 °C in all cases.
Figure 1. Relative changes in mRNA expression after stress in WT and CRH-KO mice expressed as ratio relative to unstressed control. Ordinate shows duration of immobilization, abscissa gives mRNA expression ratio relative to control (ctrl). Control mice (intact mice, time = 0) were not immobilized. If there is significant difference, then the respective increase/decrease is shown; if there is no difference, then the ratio is set to 1.0. Data are expressed as mean ± SEM. One-way ANOVA with SNK post hoc analysis (n = 4 in all groups). Abbreviations in inset key: STR: striatum; AMY: amygdala; CA3: CA3 hippocampal area; PCx: parietal cortex; WT: wild type mice; KO: CRH-KO mice; R: right hemisphere; L: left hemisphere; AChE: acetylcholinesterase; AChER: readthrough variant of acetylcholinesterase; BChE: butyrylcholinesterase. For individual changes expressed as measured values see Supplementary Figures 1–5.
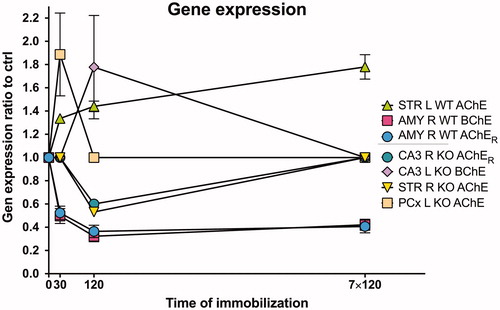
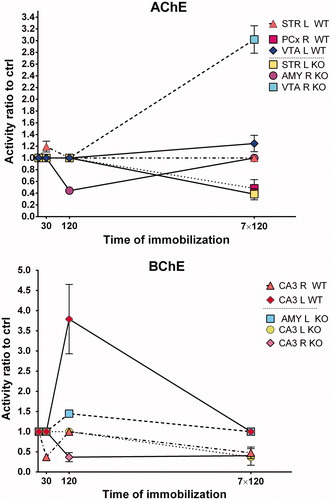
Figure 2. Changes in acetylcholinesterase (AChE) and butyrylcholinesterase (BChE) activities in KO mice expressed as ratio relative to unstressed control (ctrl). Control mice (intact mice, time =0) were not immobilized. Ordinate shows duration of immobilization, abscissa gives mRNA expression ratio relative to control. If there is significant difference, then the respective increase/decrease is shown; if there is no difference, then the ratio is set to 1.0. Data are expressed as mean ± SEM. One-way ANOVA with SNK post hoc analysis (n = 4 in all groups). Abbreviations in inset key: STR: striatum; AMY: amygdala; CA3: CA3 hippocampal area; VTA: ventral tegmental area; PCx: parietal cortex; WT: wild type mice; KO: CRH-KO mice; R: right hemisphere; L: left hemisphere; AChE: acetylcholinesterase; BChE: butyrylcholinesterase. For individual changes expressed as measured values see Supplementary Figures 6–9.