Figures & data
Table 1. Descriptive statistics, summarizing key youth stress, older-age cortisol and control variables, for 6-Day Sample participants included at each stage of the study.
Table 2. Relations between key study variables, survival to older age, and follow-up study participation.
Table 3. Relations between all youth stress measures and all older-age cortisol measures.
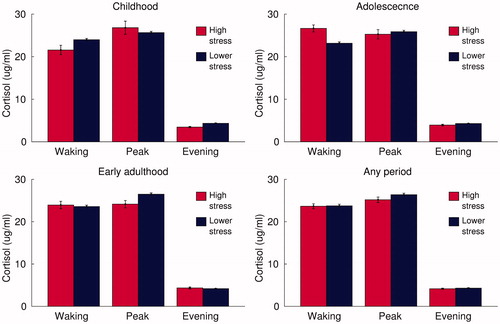
Figure 1. Older-age cortisol levels in participants exposed to high levels of stress in childhood, adolescence or early adulthood. Note: Bars represent mean salivary cortisol concentrations upon waking, around 45 min later (peak) and in the evening of the same day; in those exposed to high levels of stress at each stage of life and in remaining participants; error bars represent standard error.