Figures & data
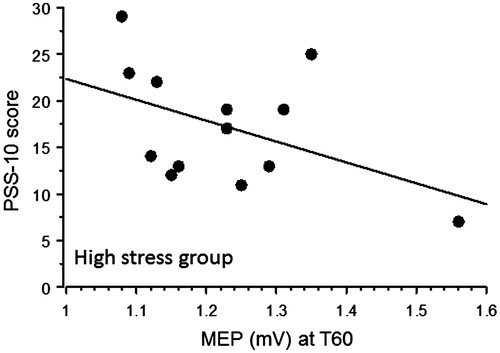
Figure 1. Perceived stress scale (PSS). Perceived stress levels were significantly higher in the High stress group compared with the Low stress group. Error bars represent standard error of the mean. **p<.01.
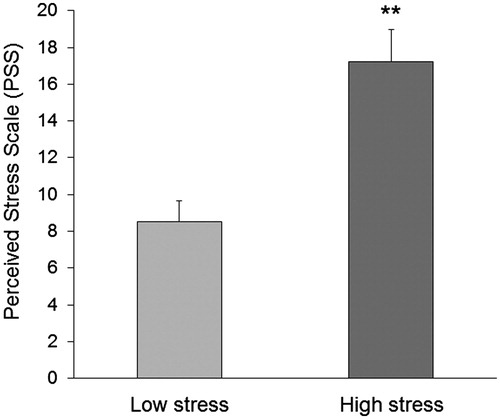
Figure 2. Paired associative stimulation (PAS). MEP amplitudes were measured in both groups at baseline, immediately (T0) and 60 minutes after PAS (T 60). There was no significant difference between groups at baseline. At T0 and T60 the Low stress group showed significant higher increased MEP size. Error bars represent standard error of the mean. *p<.05; **p<.01.
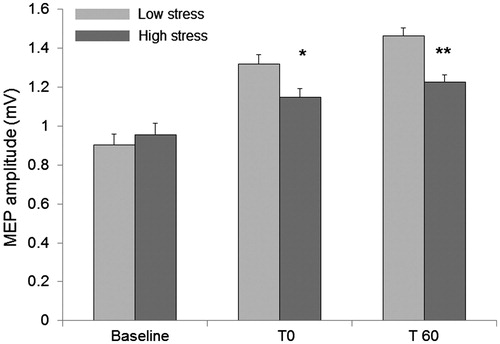
Figure 3. Spearman’s rank correlation. In the High-stress group there was an inverse correlation between MEP size at T60 and the PSS-10 mean score (Low stress p = .6; High stress p = .04).