Figures & data
Figure 1. (A, B) Photomicrograph of placement of the guide cannula in the PFC (A) and VM (B) of Mayer's hematoxylin-stained tissue sections. (C, D) Schematic drawing of the histological reconstruction of coronal sections from the PFC (A), containing the prelimbic cortex (PrL) and cingulate cortex (Cg1) and VM (B). Black dots indicate the approximate guide cannula placement. The numbers on the right upper side of the drawings indicate the distance (in mm) anterior (+) and posterior (−) to the bregma. (E, F) Drawings of the mouse sagittal sections. (G, H) The numbers under the drawings indicate the location of the right side of the two lines harvested for western blotting. Each square on the drawings of the coronal sections (in accordance with E and F) indicates the location of the tissue harvested for western blotting.
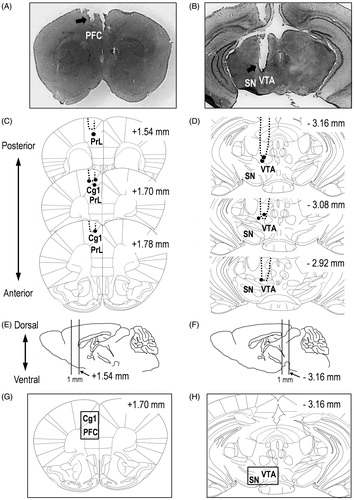
Figure 2. (A) Locomotor activity was measured 2 h after the final SDS exposure (O.F.: control, n = 5; SDS, n = 5). (B, C) Sucrose preference test (SPT: B) and total intake (C) (control, n = 5; SDS, n = 5). (D) Representative western blot of membrane and total GluR1 and GluR2 in the PFC 2 h after the final SDS exposure. (E–H) Representative graphs of the protein level of membrane GluR1 (E, control, n = 5; SDS, n = 5), membrane GluR2 (F, control, n = 5; SDS, n = 5), total GluR1 (G: control, n = 5; SDS, n = 5), and total GluR2 (H, control, n = 5; SDS, n = 5) in the PFC. (I) Representative western blot of membrane and total GluR1 and GluR2 in the VM 2 h after the final SDS exposure. (J–M) Representative graphs of the protein level of membrane GluR1 (J, control, n = 5; SDS, n = 5), membrane GluR2 (K, control, n = 5; SDS, n = 5), total GluR1 (L, control, n = 5; SDS, n = 5), and total GluR2 (M, control, n = 5; SDS, n = 5) in the VM. All data are presented as the mean ± SEM. **p < .01, *p < .05.
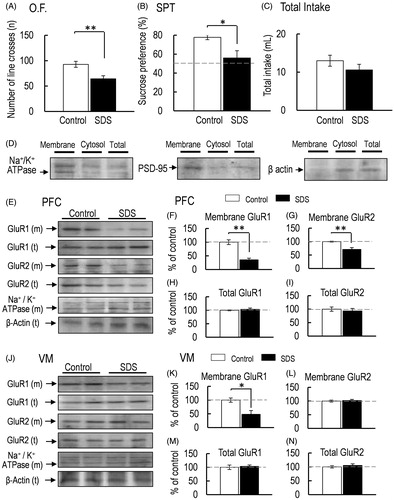
Figure 3. (A) Representative western blot of membrane and total GluR1 and GluR2 in the PFC 2 and 24 h after intra-PFC injection of aCSF or DHPG. (B–E) Representative graphs of the protein level of membrane GluR1 (B, control, n = 5; DHPG 2 h, n = 5; DHPG 24 h, n = 5), membrane GluR2 (C, control, n = 5; DHPG 2 h, n = 5; DHPG 24 h, n = 5), total GluR1 (D, control, n = 5; DHPG 2 h, n = 5; DHPG 24 h, n = 5), and total GluR2 (E, control, n = 5; DHPG 2 h, n = 5; DHPG 24 h, n = 5) in the PFC. (F) Representative western blot of membrane and total GluR1 and GluR2 in the VM 2 and 24 h after intra-PFC injection of aCSF or DHPG. (G–J) Representative graphs of the protein level of membrane GluR1 (G, control, n = 5; DHPG 2 h, n = 5; DHPG 24 h, n = 5) and membrane GluR2 (H, control, n = 5; DHPG 2 h, n = 5; DHPG 24 h, n = 5), total GluR1 (I, control, n = 5; DHPG 2 h, n = 5; DHPG 24 h, n = 5), and total GluR2 (J, control, n = 5, DHPG 2 h, n = 5; DHPG 24 h, n = 5) in the VM. (K). Locomotor activity was measured 2 and 24 h after intra-PFC injection of aCSF or DHPG (O.F.: control, n = 6; DHPG 2 h, n = 10; DHPG 24 h, n = 5). (L, M) Sucrose preference test (SPT: L) and total intake (M) were measured 2 and 24 after intra-PFC injection of aCSF or DHPG for the first 24-h (0–24 h) and the second 24-h (24–48 h) period (control, n = 5; DHPG 24 h, n = 5). All data are presented as the mean ± SEM. **p < .01, *p < .05.
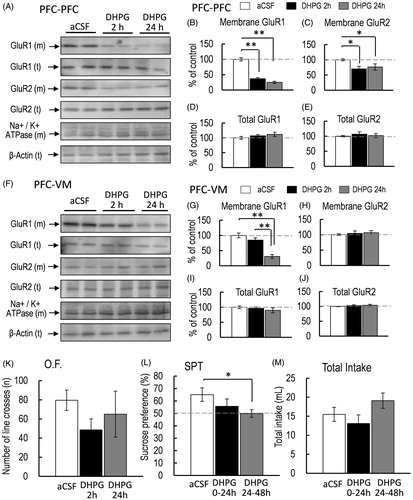
Figure 4. (A) Representative western blot of membrane and total GluR1 and GluR2 in the PFC 2 and 24 h after intra-VM injection of aCSF or DHPG. (B–E) Representative graphs of the protein level of membrane GluR1 (B, control, n = 5; DHPG 2 h, n = 5; DHPG 24 h, n = 5), membrane GluR2 (C, control, n = 5; DHPG 2 h, n = 5; DHPG 24 h, n = 5), total GluR1 (D, control, n = 5; DHPG 2 h, n = 5; DHPG 24 h, n = 5), and total GluR2 (E, control, n = 5; DHPG 2 h, n = 5; DHPG 24 h, n = 5) in the PFC. (F) Representative western blot of membrane and total GluR1 and GluR2 in the VM 2 and 24 h after intra-VM injection of aCSF or DHPG. (G–J) Representative graphs of the protein level of membrane GluR1 (G, control, n = 5; DHPG 2 h, n = 5; DHPG 24 h, n = 5), membrane GluR2 (H, control, n = 5; DHPG 2 h, n = 5; DHPG 24 h, n = 5), total GluR1 (I, control, n = 5; DHPG 2 h, n = 5; DHPG 24 h, n = 5), and total GluR2 (J, control, n = 5; DHPG 2 h, n = 5; DHPG 24 h, n = 5) in the VM. (K) Locomotor activity was measured 2 and 24 h after intra-VM injection of aCSF or DHPG (K, O.F.: control, n = 5; DHPG 2 h, n = 5; DHPG 24 h, n = 5). (L, M) Sucrose preference test (SPT: L) and total intake (M) were measured 2 and 24 h after intra-VM injection of aCSF or DHPG for the first 24-h (0–24 h) and the second 24-h (24–48 h) period (control, n = 6; DHPG 2 h, n = 8; DHPG 24 h, n = 6). All data are presented as the mean ± SEM. **p < .01, *p < .05.
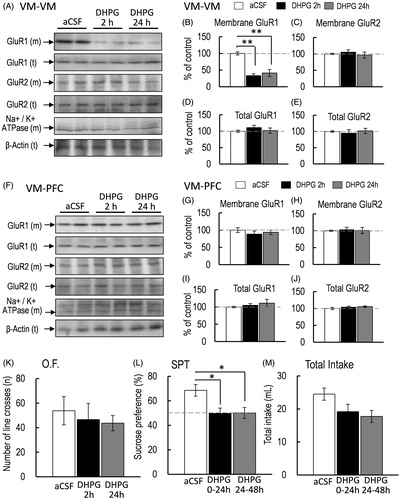
Figure 5. Effect of JNJ16259685 pretreatment on SDS mice. (A–C) The effects on the locomotor activity (A, O.F.: control-saline, n = 5; control-JNJ16259685, n = 5; SDS-saline, n = 5; SDS-JNJ16259685, n = 5), and sucrose preference test (SPT: B) and total intake (C) (control-saline, n = 5; control-JNJ16259685, n = 5; SDS-saline, n = 5; SDS-JNJ16259685, n = 5) of mice were measured for 24 h. (D, I) Representative western blot of membrane and total GluR1 and GluR2 in the PFC 2 h after the final SDS exposure. (E–H, J–M) Representative graphs of the protein level of membrane GluR1 (E, control-saline, n = 4, control-JNJ16259685, n = 4; J, control-saline, n = 5; SDS-saline, n = 5; SDS-JNJ16259685, n = 5), membrane GluR2 (F, control-saline, n = 4, control-JNJ16259685, n = 4; K, control-saline, n = 5; SDS-saline, n = 5; SDS-JNJ16259685, n = 5), total GluR1 (G, control-saline, n = 4, control-JNJ16259685, n = 4; L, control-saline, n = 5; SDS-saline, n = 5; SDS-JNJ16259685, n = 5) and total GluR2 (H, control-saline, n = 4, control-JNJ16259685, n = 4; M, control-saline, n = 5; SDS-saline, n = 5; SDS-JNJ16259685, n = 5) in the PFC. (N, S) Representative western blot of membrane and total GluR1 and GluR2 in the VM 2 h after the final SDS exposure. (O–R, T–W) Representative graphs of the protein level of membrane GluR1 (O, control-saline, n = 4, control-JNJ16259685, n = 4; T, control-saline, n = 5; SDS-saline, n = 5; SDS-JNJ16259685, n = 5), membrane GluR2 (P, control-saline, n = 4, control-JNJ16259685, n = 4; U, control-saline, n = 5; SDS-saline, n = 5; SDS-JNJ16259685, n = 5), total GluR1 (Q, control-saline, n = 4, control-JNJ16259685, n = 4; V, control-saline, n = 5; SDS-saline, n = 5; SDS-JNJ16259685, n = 5), and total GluR2 (R, control-saline, n = 4, control-JNJ16259685, n = 4; W, control-saline, n = 5; SDS-saline, n = 5; SDS-JNJ16259685, n = 5) in the VM. All data are presented as the mean ± SEM. **p < .01, *p < .05.
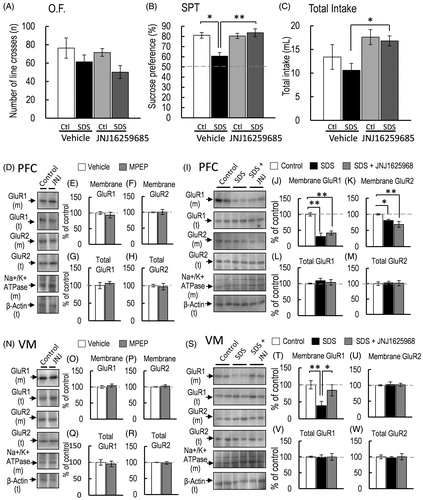
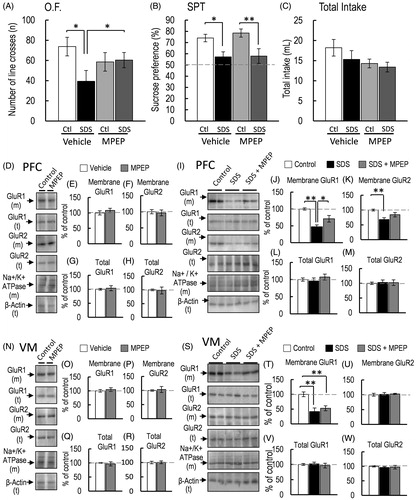
Figure 6. Effect of MPEP pretreatment on SDS mice. (A–C) The effects on the locomotor activity (A, O.F.: control-saline, n = 5; control-MPEP, n = 5; SDS-saline, n = 5; SDS-MPEP, n = 5), and sucrose preference test (SPT: B) and total intake (C) (control-saline, n = 5; control-MPEP, n = 5; SDS-saline, n = 5; SDS-MPEP, n = 5) of mice were measured for 24 h. (D) Representative western blot of membrane and total GluR1 and GluR2 in the PFC 2 h after the final SDS exposure. (E–H, J–M) Representative graphs of the protein level of membrane GluR1 (E, control-saline, n = 4, control-MPEP, n = 4; J, control-saline, n = 5; SDS-MPEP, n = 5; SDS-JNJ16259685, n = 5), membrane GluR2 (F, control-saline, n = 4, control-MPEP, n = 4; K, control-saline, n = 5; SDS-saline, n = 5; SDS-MPEP, n = 5), total GluR1 (G, control-saline, n = 4, control-MPEP, n = 4; L, control-saline, n = 5; SDS-saline, n = 5; SDS-MPEP, n = 5) and total GluR2 (H, control-saline, n = 4, control-MPEP, n = 4; M, control-saline, n = 5; SDS-saline, n = 5; SDS-MPEP, n = 5) in the PFC. (N, S) Representative western blot of membrane and total GluR1 and GluR2 in the VM 2 h after the final SDS exposure. (O–R, T–W) Representative graphs of the protein level of membrane GluR1 (O, control-saline, n = 4, control-MPEP, n = 4; T, control-saline, n = 5; SDS-saline, n = 5; SDS-MPEP, n = 5), membrane GluR2 (P, control-saline, n = 4, control-MPEP, n = 4; U, control-saline, n = 5; SDS-saline, n = 5; SDS-MPEP, n = 5), total GluR1 (Q, control-saline, n = 4, control-MPEP, n = 4; V, control-saline, n = 5; SDS-saline, n = 5; SDS-MPEP, n = 5), and total GluR2 (R, control-saline, n = 4, control-MPEP, n = 4; W, control-saline, n = 5; SDS-saline, n = 5; SDS-MPEP, n = 5) in the VM. All data are presented as the mean ± SEM. **p < .01, *p < .05.