
Figures & data
Table 1. Sample characteristics at time of hair cortisol sampling.
Table 2. Scores of ERI scales at T1, T2, as well as mean and change scores.
Figure 1. Association of change in the job security scale between T1 and T2 and transformed (Log 10) hair cortisol concentration (HCC) (see file attached).
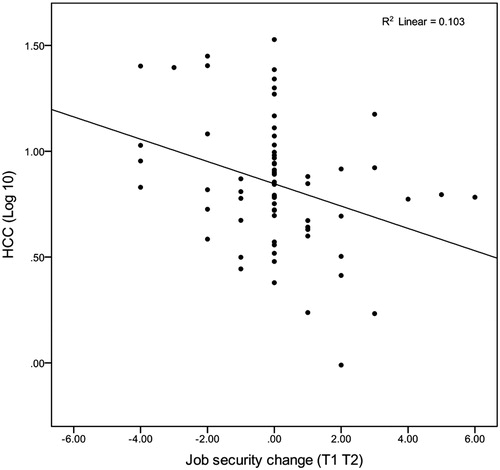
Table 3. Unadjusted effects of single time points (T1, T2) ERI measures, as well as mean and change scores of ERI scales on hair cortisol concentration (Log10).
Table 4. Adjusted effects of single time points (T1, T2) ERI measures, as well as mean and change scores of ERI scales on hair cortisol concentration (Log10).