Figures & data
Table 1. Sociodemographic data of included and excluded participants.
Table 2. Descriptive information of self-reported status and health (individual/level 2 variables).
Table 3. Saliva α-amylase activity (U/ml) and collection times (hrs) over two days.
Figure 1. Illustration of alpha-amylase activity by time according to high versus low subjective social status (SSS) in the police.
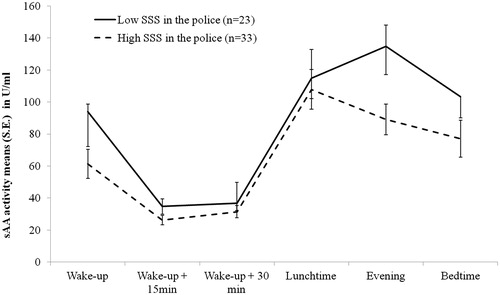
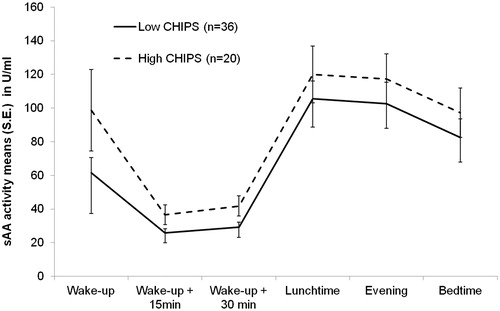
Figure 2. Illustration of alpha-amylase activity by time according to high versus low levels of physical problems (CHIPS).