Figures & data
Figure 1. Effects of MS on the index of maternal behavior. No significant difference was observed when the index of maternal behavior from the AFR and MS animals was compared. Data presented as mean ± standard error of the mean (SEM), as well as estimated marginal means and confidence interval; AFR: n = 17 e MS: n = 19. Student’s t-test for independent samples.
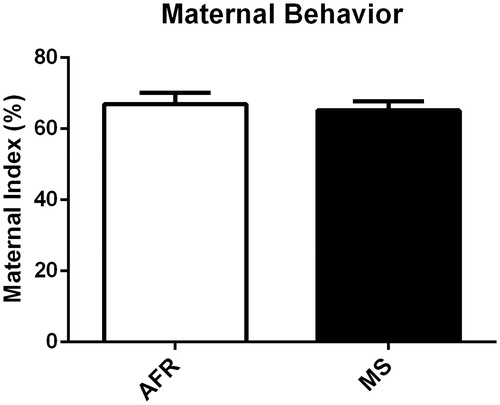
Figure 2. Effects of MS on the daily frequency of maternal care pre-MS and post-MS. Analysis of the maternal index pre-MS throughout the 6 days showed an interaction between days and group, but this effect was not observed post-MS. Pre-MS on PND2, PND3 and PND4 there was an increased number of maternal behaviors in the AFR group when compared to the animals exposed to MS. On PND6 and PND7, the pattern was altered, and the animals in the MS group presented an increased number of maternal behaviors when compared to the AFR group. Post-MS, there was no difference between animals exposed to stress and control group. Data are expressed as mean ± standard error of the mean (SEM), as well as estimated marginal means and confidence interval; AFR: n = 17 e MS: n = 19. Repeated measure ANOVA and Student’s t-test for independent samples *p < .05.
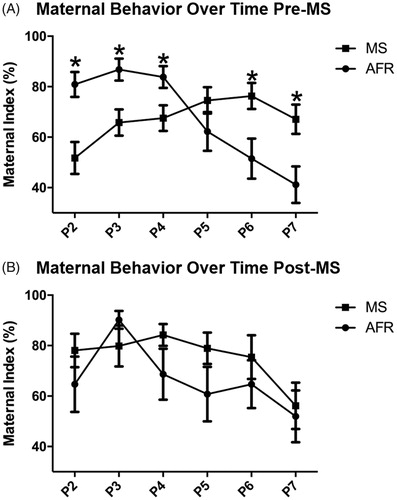
Figure 3. Analysis of different maternal behaviors throughout the days. (A) Maternal behavior of nursing was more frequent on PND2 and PND3. There was an inversion on the frequency of nursing on PND7; AFR: n = 17 and MS: n = 19 (B) The nonmaternal behavior of no interaction was more frequent on PND2 and PND3. There was a decrease in the MS group regarding no interaction behavior on PND7 when compared to control; AFR: n = 17, MS: n = 19. (C) On PND2, MS dams presented higher eating/drinking behavior when compared to the control group. AFR: n = 17, MS: n = 19. Data are presented as the mean of the observed behaviors ± SEM, as well as estimated marginal means and confidence interval. Mann–Whitney U-test *p < .05.
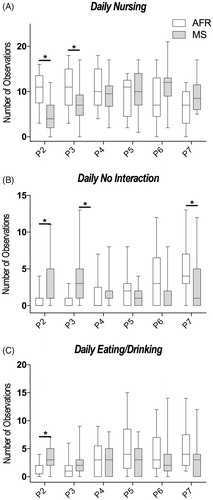
Figure 4. Open field test comparing MS-exposed dams to AFR. (A) Dams exposed to MS presented the spontaneous locomotor activity as the controls; (B) Dams exposed to MS did not differ from the AFR dams in time spent in the center of the apparatus; (C) MS dams showed a significant increase in the number of rearing compared to AFR dams; (D) There was no difference in the number of self-grooming in the open field test; Data presented as mean ± standard error of the mean (SEM); AFR: n = 6e MS: n= 6. Student’s t-test for independent samples. *p < .05.
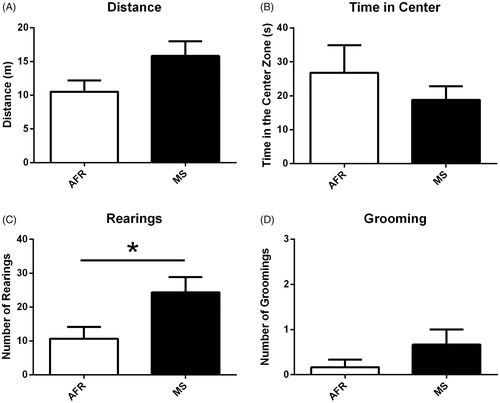
Figure 5. The light/dark box test comparing MS-exposed dams to AFR. (A) MS dams spent significantly less time in the bright compartment compared to the AFR dams; (B) latency to first enter in the dark box was significantly higher in the MS dams; (C) MS dams did not differ from the AFR dams in the number of transitions between the dark and the bright side of the apparatus. Data presented as mean ± standard error of the mean (SEM); AFR: n = 6e MS: n = 6. Student’s t-test for independent samples. *p < .05.
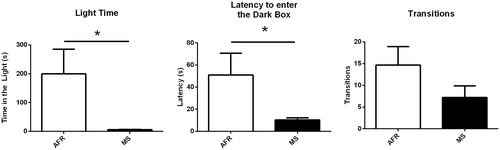
Figure 6. The social interaction test comparing MS-exposed dams to AFR did not showed any statistical significant differences between groups. Data presented as mean ± standard error of the mean (SEM); AFR: n = 6e MS: n= 6.
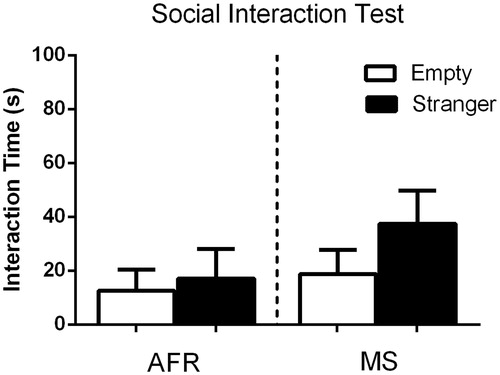
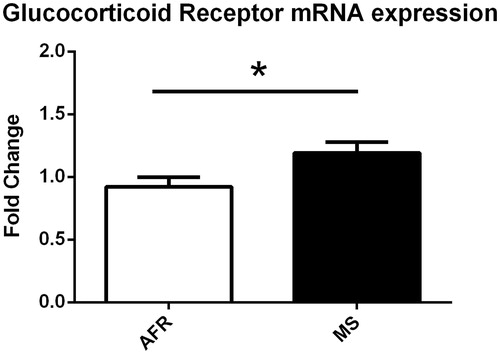
Figure 7. MS-exposed dams present increased glucocorticoid receptor mRNA expression. AFR: n = 6e MS: n = 6. Hippocampal gene expression normalized to GAPDH using the ΔΔCt method and relative to AFR. Data presented as mean ± standard error of the mean (SEM) *p < .05.