
Figures & data
Table 1. Demographic Information.
Figure 1. Upon arrival, the mother and child engaged in a free play to familiarize the child with the lab before the stressor. The first saliva sample was collected after the stress paradigm which took 20 min, reflecting salivary cortisol baseline levels before the stressor. The second sample was collected 20 min after the first collection, indicating peak salivary cortisol levels immediately following the stressor. The third sample was collected 40 min after the first collection, indicating children’s salivary cortisol levels after the stressor.
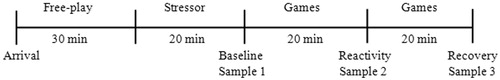
Table 2. Raw salivary cortisol and hair cortisol concentration values.
Figure 2. Preschool children’s salivary cortisol reactivity in response to a challenging task. Salivary cortisol levels increased significantly from baseline to 20-min post- stressor (t = −2.39, p = 0.020), indicating reactivity to the paradigm. Salivary cortisol levels were not significantly different from 20-min to 40-min post-stressor, indicating children did not show recovery within the same time frame. Error bars represent ±1 SE.
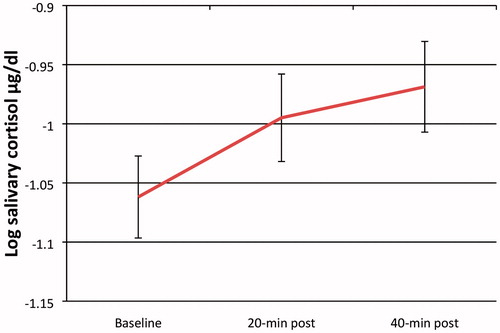
Figure 3. Scatterplot showing (a) the relationship between children’s HCC and salivary cortisol total output (AUCg) and (b) the relationship between children’s HCC and salivary cortisol reactivity (AUCi).
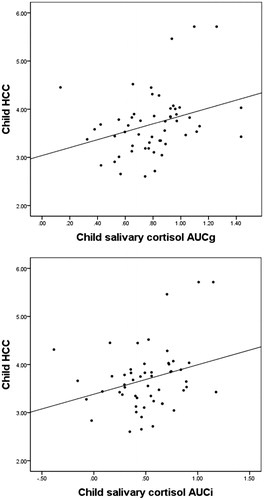
Table 3. Correlations amongst Measures.