
Figures & data
Table 1. Functions of uterine genes potentially involved in eggshell formation.
Figure 1. Diagram of the processes in shell formation, with roles of genes measured in the present study.
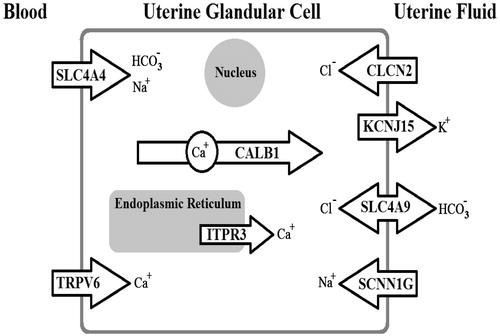
Figure 2. Specificity of real time PCR amplification. Melting curves (dissociation curves) of the 8 target genes and 1 reference gene (β-actin) amplicons after the real time PCR reactions, all showing one peak. X-axis (horizontal): temperature (°C); Y-axis (vertical): negative derivative of fluorescence over temperature (−dF/dT).
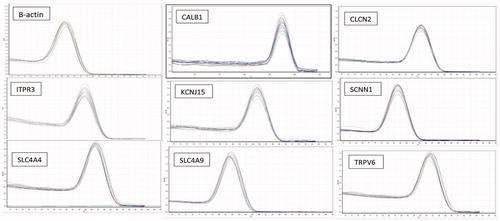
Table 2. Primers used for quantitative real time PCR analysis of mRNAs in laying hen uterus.
Table 3. Parameters of egg quality in last week of experiment.
Table 4. Relative gene expression of ion transporters in the uterine lining (glands + epithelium) of laying hens.