
Figures & data
Table 1. Data are expressed in mean ± standard deviation.
Figure 1. Association between ACEs on neural response during affective Theory of Mind. Threshold at cluster level pFDR < .05.
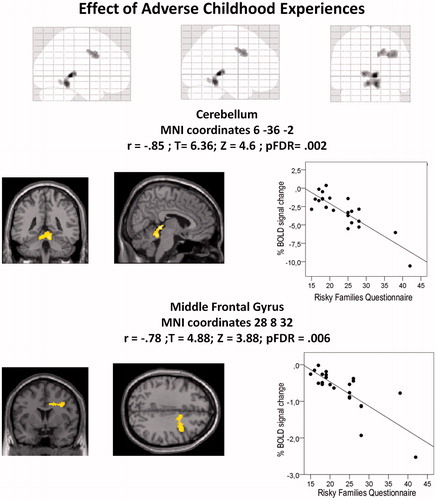
Table 2. fMRI results are reported at cluster level: pFDR, k, cluster size in voxels; peak level: pFDR, MNI coordinates (x, y, z) of voxels with higher T and Z values (signal peaks) and regions included in the activated cluster.