
Figures & data
Figure 1. Garisakang unadjusted mean (shaded interquartile range) waking cortisol concentration (top) and diurnal cortisol slope (bottom) across the lifespan, stratified by sex.
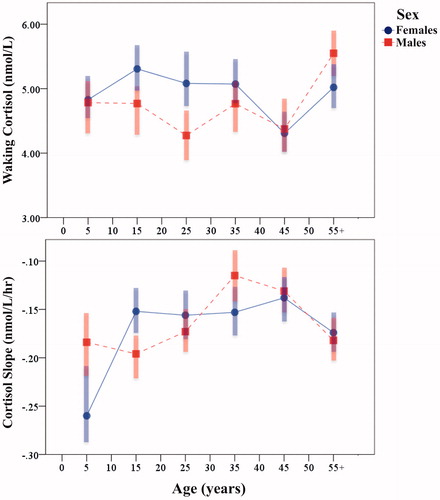
Table 1. Sample characteristics (mean, SD) for subadults and adults by sex.
Figure 2. Garisakang all-age estimated mean cortisol concentration (shaded 95% CI) by time post-waking, stratified by sex.
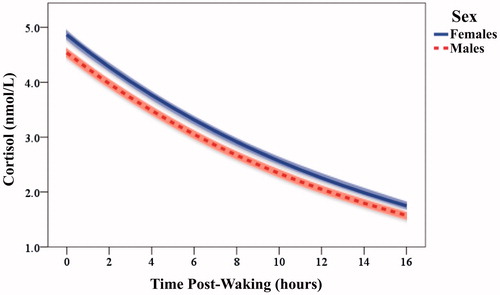
Table 2. Multilevel models of Garisakang log10-transformed diurnal cortisol rhythms (nmol/L).
Table 3. Comparative studies reporting salivary diurnal cortisol rhythms in diverse populations. The findings of the present study are provided in bold.