Figures & data
Table 1. Sample characteristics at baseline.
Figure 1. CONSORT flow diagram. ITT: intention-to-treat.
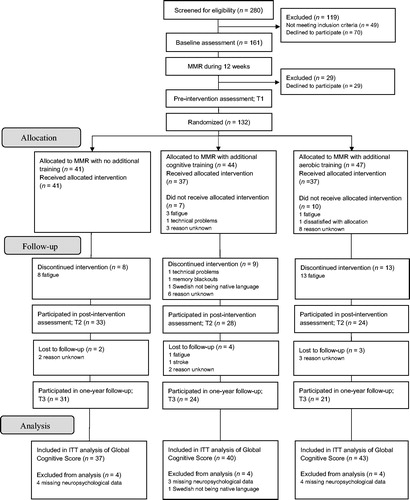
Table 2. Means and standard deviations on the cognitive variables for each group and time-point.
Table 3. Long-term training-related effects on the cognitive variables.
Figure 2. Changes across time for each group based on the estimated means from the model in (A) performance on the global cognitive score, based on the mean z-score of nine cognitive tests covering the domains executive function, working memory, episodic memory, processing speed, and reasoning ability; (B) performance in episodic memory; (C) performance on the cognitive training criterion updating task and; (D) aerobic capacity. Error bars indicate SEM. T1: pre intervention; T2: post intervention; T3: one-year follow-up; VO2max: maximal oxygen uptake.
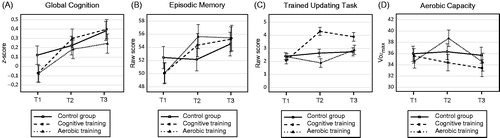
Table 4. Means and standard deviations on psychological variables, work ability, and aerobic capacity for each group and time-point.
Table 5. Long-term training-related effects on psychological variables, work ability, and aerobic capacity.
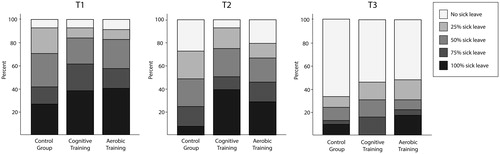
Figure 3. The distribution of sick leave levels for each group at the different time-points. Total number of observations: T1: n = 132; T2: n = 85; T3: n = 82. T1: pre intervention; T2: post intervention; T3: one-year follow-up.