Figures & data
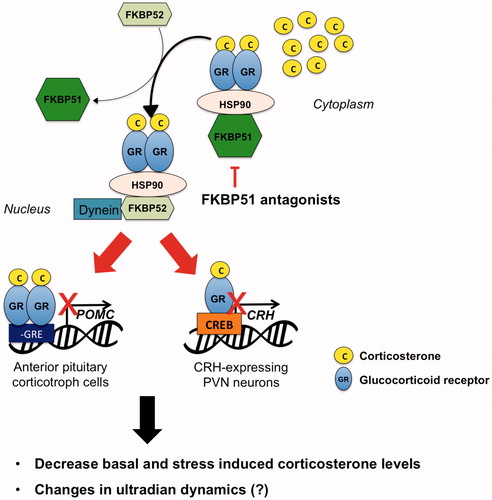
Figure 1. Ultradian rhythms of the hypothalamic–pituitary–adrenal (HPA) axis and glucocorticoid rhythms. The hypothalamic paraventricular nucleus (PVN) receives circadian input from the suprachiasmatic nucleus of the hypothalamus and stress inputs from the brainstem and from regions of the limbic system such as the hippocampus and amygdala. The PVN projects to the median eminence where it releases corticotrophin-releasing hormone (CRH) and arginine vasopressin (AVP) into the hypothalamic-pituitary portal circulation. CRH passes through this vascular route to access corticotroph cells in the anterior pituitary, which respond with the rapid release of adrenocorticotropic hormone (ACTH) from preformed vesicles into the general circulation. In turn, ACTH reaches the adrenal cortex where it activates the synthesis and secretion of glucocorticoid hormones (CORT). CORT regulate the activity of the HPA axis, and thus their own production, through feedback mechanisms acting at the level of the pituitary gland where they inhibit ACTH release, and at the level of the PVN where they inhibit the release of CRH and AVP. Under basal (i.e., unstressed) conditions, an ultradian pattern of secretion underlies all the components of the HPA axis. Note that in the rat, CRH pulse frequency is higher (∼3 pulses/h) than the near-hourly oscillation in ACTH and CORT. Reproduced with permission from (Spiga et al., Citation2014).
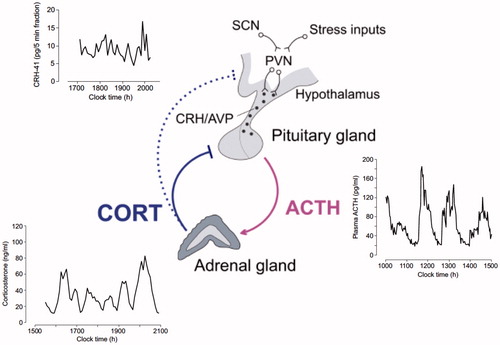
Figure 2. Mathematical modeling predictions and experimental data illustrating the pituitary-adrenal response to different levels of constant CRH drive. (A) Computed two-parameter bifurcation diagram shows that different combinations of constant CRH drive and adrenal delay result in qualitatively different dynamic responses from the pituitary–adrenal system. On one side of the transition curve, the pituitary–adrenal system responds with oscillations in ACTH and glucocorticoids (CORT), despite the fact that the CRH drive is constant (point B). On the other side of the transition curve, the pituitary-adrenal system responds with steady state levels in ACTH and CORT (point C). (B) Model predictions for ACTH (gray) and CORT (black) corresponding to point B (oscillation) and point C (steady state) in panel (A). (C) Constant infusion of low and high doses of CRH induces pulsatile or constant secretion of CORT, respectively. In line with the modeling hypothesis, constant infusion of a low dose of CRH (0.5 μg/h) induces ultradian corticosterone oscillations that persist throughout the infusion period (top graph). In contrast constant infusion of a high-dose CRH (5 μg/h) results in constant secretion of CORT (bottom graph). Samples were collected every 5 min from a freely behaving male rat using an automated blood sampling system. Grey bar indicates the period of infusion. Reproduced with permission from (Spiga et al., Citation2014).
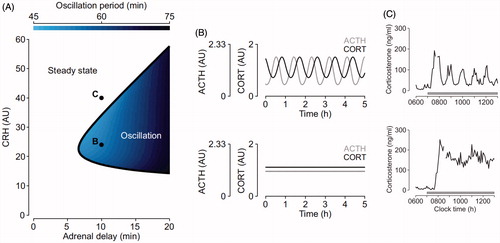
Figure 3. Hypothetical mechanisms underlying the effects of a FKBP51 antagonist administration on HPA axis activity. GR is normally localized in the cytosol in a complex with chaperone proteins including FKBP51. CORT increased during stress or at circadian peak induces the detachment of GR from FKBP51 and its binding to FKBP52, leading to GR nuclear translocation and binding to DNA. GR expressed in the anterior pituitary and PVN regulates CORT negative feedback by reducing POMC and CRH synthesis, respectively. Treatment with a FKBP51 will facilitate GR binding to FKBP52 thus GR genomic effect and negative feedback inhibition. This will ultimately result in decreased CORT secretion, and presumably in changes in ultradian rhythmicity.