
Figures & data
Table 1. Sample characteristics M (SD).
Table 2. Cortisol values (nmol/L).
Figure 1. Stress-related change in salivary cortisol (AUCi) as a function of sleep quality in S’/S’ and L’/L’ 5-HTTLPR genotype. Interaction: p < .01.
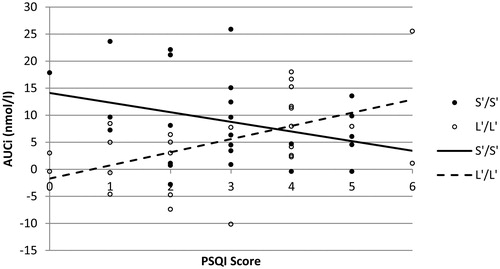
Table 3. Summary of hierarchical regression analysis for variables predicting AUCi.
Figure 2. Mean (±SEM) cortisol levels as a function of 5-HTTLPR genotype in individuals reporting high (PSQI ≤3) or low (PSQI ≥4) sleep quality.
